Geoscience Reference
In-Depth Information
Table 5.8
Seafloor example. Comparison of WLR results
Variable
W
+
s
(W
+
) W
s
(W
) W
R
+
s
(W
R
+
)W
R
s
(W
R
)
Age
1.77205 0.30180
1.71651 0.70713
1.96126 0.37914
1.89979 0.81868
Topography 0.67433 0.33344
0.74367 0.50004
0.36013 0.41223
0.34885 0.60241
Contact
1.18719 0.31640
1.19888 0.57738
0.28949 0.35277
0.28041 0.63265
Rock type
0.42831 0.40835
0.26130 0.37801
0.04663 0.44083
0.04517 0.41710
No fissures
0.04299 0.57743
0.13127 0.31628
0.19919 0.62718
0.19294 0.37332
Source: Agterberg (
2011
, Table 3)
40
35
30
25
20
15
10
5
0
0
0.05
0.1
0.15
0.2
0.25
0.3
0.35
0.4
Posterior probability
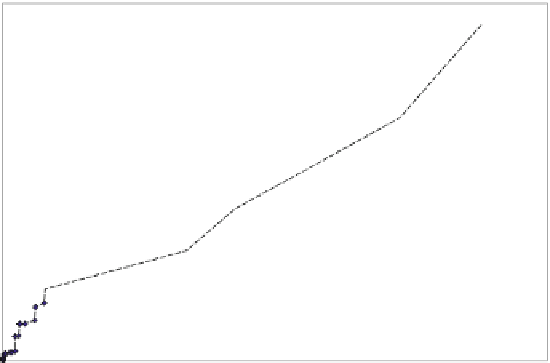
Fig. 5.29
Seafloor Example: Hydrothermal vents on East Pacific Rise. Estimated and observed
numbers of vents in 5-layer model (Source: Agterberg and Cheng
2002
, Fig. 1)
Table 5.9
Estimation of
T
and
s
2
(
T
) for 3-layer model
Area (km
2
)
N
IJK
2
s
2
(
P
f
)
IJK
P
f
s
(
P
f
)
N
IJK
P
f
222
1.344
0.0003
0.0005
0.0403
0.0045
212
0.9007
0.0057
0.0065
0.5134
0.3428
221
0.4351
0.0008
0.0013
0.0348
0.0032
122
0.4187
0.0111
0.0126
0.4648
0.2783
112
0.3415
0.1709
0.0907
5.8362
9.5939
211
0.2223
0.0154
0.0176
0.3423
0.1531
111
0.1771
0.3604
0.153
6.3827
7.3421
121
0.1456
0.0297
0.336
0.4324
23.9332
Sum 3.985
14.0470
41.6511
Source: Agterberg and Cheng (
2002
, Table 3)
I
age,
J
topography,
K
rock type;
N
¼100
Area


Search WWH ::

Custom Search