Geoscience Reference
In-Depth Information
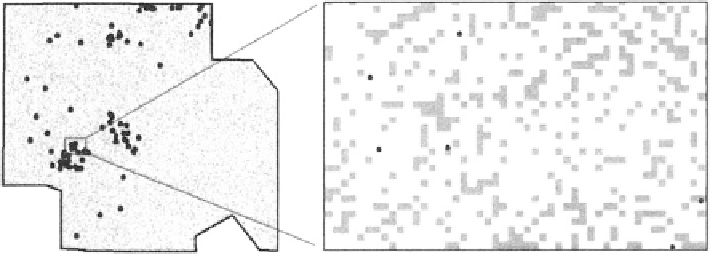
Fig. 5.25
Training set of 139,634 (100 m
100 m) randomly selected from grid on Gowganda
area (Fig.
5.24a
) used in Experiment 1. Enlargement of small part of pattern (
right
) to show
relations between randomly selected cells and gold occurrences. Different selection of cells, also
randomly selected was used in Experiment 2 (Source: Agterberg and Bonham-Carter
2005
, Fig. 2)
As has been explained before, the WofE method consists of updating the prior
probability for a small unit cell or pixel. Posterior probabilities are derived by
applying Bayes' rule separately to every map layer considered. Results are inde-
pendent of the order of map layers during updating. In Experiments 1-5, unit cell
area was set equal to 0.1 km
2
. This implies that the prior probability for a unit cell
anywhere in the study area is equal to (90/56,097.6
) 0.001604. WofE is a
GIS-based statistical method. The study area is divided into polygons (or pixels)
characterized by different strings of code numbers for map layers. The area of a
“unique condition” is equal to the sum of areas (polygons or pixels) with the same
string of code numbers. In the simplest kind of application, map layers are binary
with two code numbers denoting presence and absence, respectively. In the
Gowganda WofE applications, the three binary map layers result in eight unique
conditions only.
In the WLR applications, the input data also are for unique conditions but there
are many more of these, because all patterns delineated by contours in Fig.
5.24b, c
were assigned separate integer code numbers increasing according to value. For
example, the training set for WLR Experiment 1 has 850 unique conditions. Every
unique condition is weighted according to the sum of areas of its polygons (or grid
cells) and according to the number of mineral deposits it contains (nearly always
equal to 1 in Experiments 1-5 because there are relatively few mineral deposits;
e.g., 23 in Experiment 1).
The WofE posterior probability map for the Gowganda area (not shown here),
which is based on the eight unique conditions, shows stronger spatial correlation
with the 80 Au occurrences than the original map patterns of Fig.
5.24a
. The
posterior probabilities range from 0.00074 to 0.17880. An accompanying confi-
dence map indicates that the smallest and largest posterior probabilities are either
significantly lower or higher than the prior probability.
Figure
5.25
shows the training set of randomly selected cells for Experiment
1. As mentioned before, the Gowganda study area was subdivided into 560,976
¼
Search WWH ::

Custom Search