Geoscience Reference
In-Depth Information
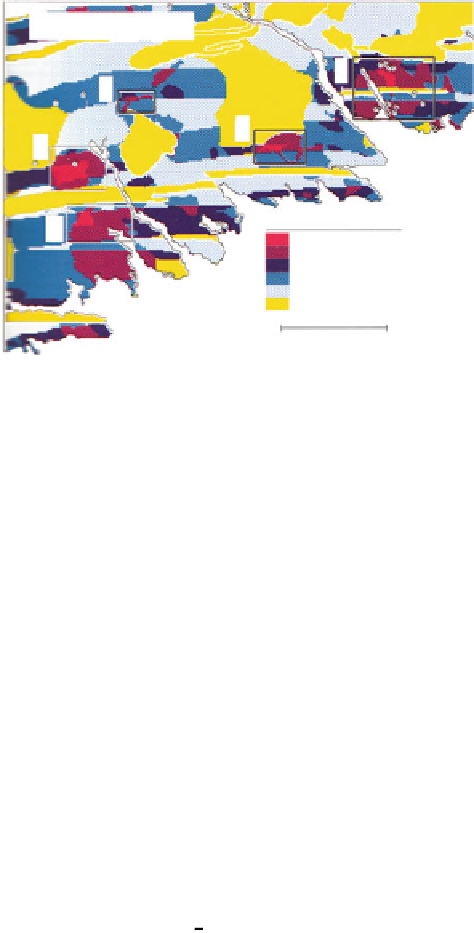
Fig. 5.12
Map of posterior
probabilities (enlarged
subarea of Fig.
5.9
) showing
areas for follow-up
exploration. Area
A
is at the
head of Gegogan Harbour;
B
is the Goldenville district
including the Goldenville
mine working;
C
is north of
the Sherbrooke pluton;
D
is
an area almost 6 km north of
Holland Harbour, through
which Indian River flows;
and
E
is the area around
Isaacs Harbour inlet
(Source: Bonham-Carter
et al.
1990
, Fig. 5)
Areas of Interest
E
C
D
B
Posterior Probability
A
>
0.300
−
−
−
−
0.300
0.200
0.200
0.100
0.100
0.080
0.040
MASK (
<
1.5 SD)
0.080
10 km
Chap. 14). Such expressions are valid only if a number of conditions are satisfied
including the condition that the probabilities in the P-matrix (Sect.
5.1.2
) are neither
large (
close to zero). The latter condition has probably
been violated for some of the rock types with few gold deposits in Table
5.1
. For
example, there are only two occurrences on Devonian granite contributing 0.5 to the
variance of their positive weight (
W
+
¼
close to one) nor small (
¼
(
W
+
)
0.7086 in
Table
5.1
is probably too large. As mentioned before, presence of Devonian granite
could be switched with its absence, which would be a better indicator than its
presence. If weights of map layers are very small, including them for calculation of
posterior probabilities does not significantly affect final results.
The standard deviation of a posterior probability can be estimated as follows.
The variance
¼
1.7360) so that
˃
¼
2
(
p
) of a prior probability
p
satisfies approximately
p
/
n
. For
˃
p
¼
68/2,945
¼
0.0231,
this yields the standard deviation
˃
(
p
)
¼
0.0028. The
corresponding standard deviation of the prior logit log
e
[
p
/(1
p
)]
¼
3.7450 is
˃
(
p
)/
p
¼
approximately
0.1213. This follows from the approximate identity for any
variable
x
with mean
x
:
x
¼
x
¼
˃
ð
log
e
x
Þ
d
log
e
x
ð
Þ
1
x
:
ðÞ
˃
x
dx
Suppose, for example, that a unit cell in Fig.
5.7
has the following features. Its
geochemical signature is unknown; it occurs in the Goldenville Formation and not
near a granite contact, but in the proximity of an anticline axis, NW lineament and
Goldenville/Halifax contact. Then its posterior logit is
2.598 as can be seen when
the appropriate weights are used. The variance of the log posterior odds is derived
by adding variances of weights to the variance of the log prior odds. It follows that


Search WWH ::

Custom Search