Geoscience Reference
In-Depth Information
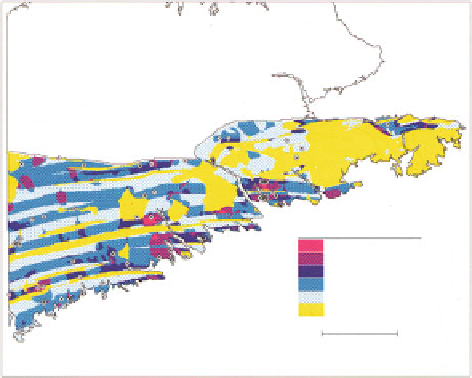
Fig. 5.9
Posterior
probability map including
balsam fir data based on
weights shown in Table
5.1
(Source: Bonham-Carter
et al.
1990
, Fig. 2c)
Posterior Probability for Au with Mask
(Including Balsam Fir)
Legend
>
0.300
0.200
−
−
−
−
0.300
0.100
0.080
0.200
0.100
0.040
MASK (
<
1.5 SD)
0.080
20 km
probabilities greater than 0.3 would be of interest, because probability of a gold
occurrence within a 1 km
2
area is about 1-3. Two of the areas (B an E) are known
gold districts. A, C and D, on the other hand, have no reported occurrences, yet they
contain essentially the same signatures as B and E.
5.1.3 Flowing Wells in the Greater Toronto Area
Cheng (
2004
) has given the following application of Weights-of-Evidence model-
ing. Figure
5.13
shows surficial geology of Oak Ridge Moraine (ORM) for a study
on assessment of flowing water wells in the Greater Toronto area, Ontario. The
ORM is a 150 km long east-west trending belt of stratified glaciofluvial-
glaciolacustrine deposits. It is 5-15 km wide and up to 150 m thick. For more
detailed discussion of the geology of ORM, see Sharpe et al. (
1997
). It is generally
recognized that the ORM is the main source of recharge in the area. Figure
5.14
shows flowing wells together with ORM and distances between wells and ORM.
Cheng (
2004
) used Weights-of-Evidence to test the influence of the ORM on
locations of flowing wells. A number of binary patterns were constructed by
maximizing the contrast
C
. For distance from ORM,
C
reaches its maximum at
2 km (inset on Fig.
5.14
). it means that a YES-NO binary pattern with YES on
points belonging to ORM plus all points that occur less than 2 km from ORM and
NO for the remainder of the study area with points that are more than 2 km away
from ORM provides positive and negative weight that would be best to use for a
binary pattern of the type because
C
W
has been maximized.
Other binary patterns constructed in the same way by Cheng (
2004
, Table 1) were
distance from buffer zone constructed around ORM (Fig.
5.15
), distance from a
relatively steep slope zone (Fig.
5.16
), and distance from a relatively thick glacial
W
+
¼
Search WWH ::

Custom Search