Geoscience Reference
In-Depth Information
(a)
(b)
(c)
(d)
(e)
(f)
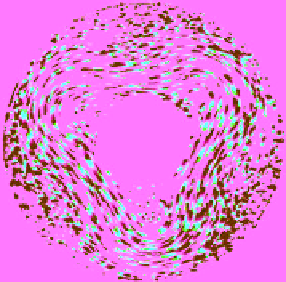
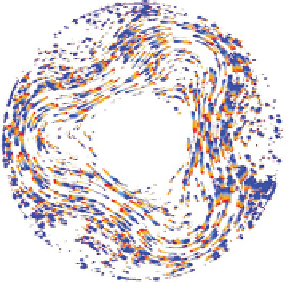
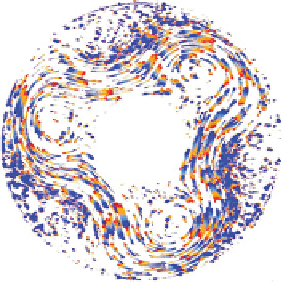
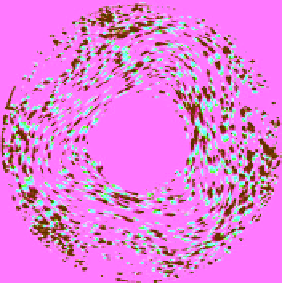
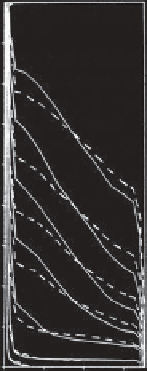
Figure 1.9.
Typical horizontal flow fields (streak photographs) during an “amplitude vacillation” cycle of the rotating annulus in
the same system as in Figures 1.8-1.13. For color detail, please see color plate section.
(a)
(b)
(c)
12.44
12.44
12.44
10.89
10.89
10.89
9.33
9.33
9.33
7.78
7.78
7.78
6.22
6.22
6.22
4.67
4.67
4.67
3.11
3.11
3.11
1. 5 6
1. 5 6
1. 5 6
0.00
2.50 4.06 5.61
Radius
0.00
2.50
0.00
2.50 4.06 5.61
Radius
7. 1 7
4.06 5.61
Radius
7. 1 7
7. 1 7
Max.
Min.
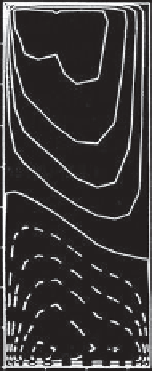
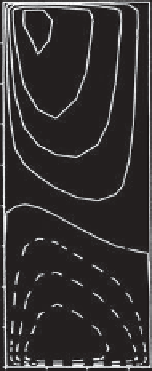
Figure 1.10.
Results from numerical simulations of a baroclinic amplitude vacillation in a rotating annulus similar to that of
Hignett et al.
[1985] showing (a) azimuthal mean azimuthal flow at maximum wave amplitude, (b) azimuthal mean azimuthal
flow at minimum wave amplitude, and (c ) azimuthal mean temperature fields at minimum (solid) and maximum (dashed) wave
amplitude during the vacillation cycle.