Geoscience Reference
In-Depth Information
Ω
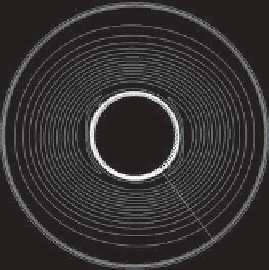
= 0.25 rad/s
Ω
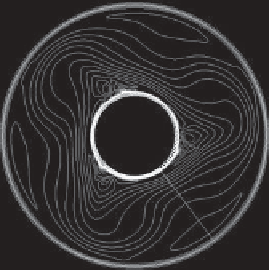
= 0.35 rad/s
Ω
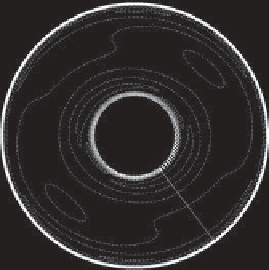
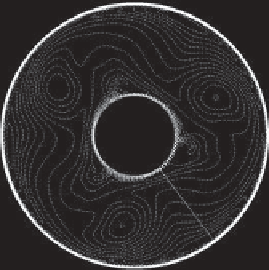
= 0.5125 rad/s
Figure 16.5.
Instantaneous isotherms for the three rotation rate values at different heights of the liquid-filled cavity: top at
midheight
z/d
= 0.5, bottom at
z/d
= 0.19.
10
7
)
,
respectively, in Figure 16.3, the simulation predicts two
regular wave regimes characterized spatially by dominant
azimuthal wave numbers
m
=2and
m
= 3, respectively,
as revealed by instantaneous isotherms in Figure 16.5 and
temporally by an amplitude vacillation. These solutions
have been directly obtained by progressively increasing
the rotation rate; e.g., the solution at the higher rota-
tion rate
= 0.5125 rad/s was computed using as initial
conditions the one at lower rotation rate
= 0.35 rad/s.
The simulations were not able to capture any steady reg-
ular wave flow, although experiments reported 2S and
3S regimes in Figure 16.3, keeping in mind that 2AV
(3AV) regimes resulted experimentally from steady waves
2S (3S) by decreasing the rotation rate (see Chapter 3).
Moreover, as soon as the large-scale regular baroclinic
structures arise, we have observed the spontaneous devel-
opment of small-scale fluctuations particularly along the
cold inner cylinder, even though experimental studies did
not mention such a behavior. However, it can be explained
by possible technical limitations to detect the very low
level of these fluctuations at these rotation rates [
Read
,
1992]. Thus, in some particular regions, the computed
flow exhibits locally a spatiotemporal chaotic behavior.
As introduced previously by
Randriamampianina et al.
[2006] to describe the temporal characteristics, we use the
10
6
)
and
(
0.5586,1.24
strong waves, and
Castrejón-PitaandRead
[2007] reported
a ratio up to 10 in their air-filled experiment. In our case,
for the dimensionless drift frequency, we have obtained a
ratio of 2 between the weak wave at
= 0.25 rad/s and
the next strong wave at
= 0.35 rad/s, and a ratio of 1.22
between the two regular waves. These behaviors are con-
sistent with the measurements of
Hide and Mason
[1978]
in a liquid-filled cavity, keeping in mind that the computed
solutions at
= 0.25 rad/s and
= 0.35 rad/s are charac-
terized by the same dominant wave number
m
= 2, while
at
= 0.5125 rad/s, the dominant azimuthal wave number
is
m
= 3. Both experimental investigations, using liquids
[
Hide and Mason
, 1978] or air [
Castrejón-Pita and Read
,
2007], mentioned the marked transition between weak and
strong waves. It is concluded that the presence of weak
waves prevents the occurrence of a hysteresis cycle during
the transition from the upper symmetric regime to reg-
ular waves, as these two phenomena were not observed
simultaneously.
To our knowledge, the present numerical study repre-
sents the first simulation cleary showing such a weak wave
flow occurring prior to the regular wave regime within a
baroclinic cavity, in agreement with experimental findings.
(
,Ta
)
=
(
1.1977,5.78
×
×
16.3.2.2. Amplitude Vacillation Flow Regime.
At
values of 0.35 and 0.5125 rad/s, corresponding to