Geoscience Reference
In-Depth Information
14.6. CYCLONE-ANTICYCLONE ASYMMETRY
(Bu
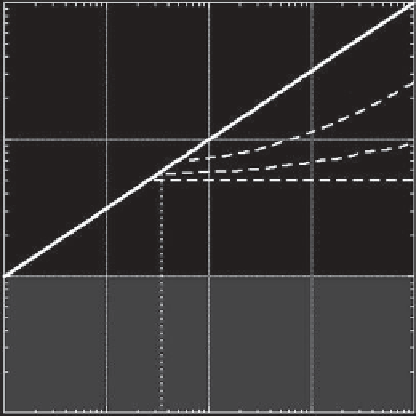
1) dynamics, we draw an arbitrary line (thin dot-
ted line) at Bu = 0.3. Of course, this vertical line is not an
exact limit and does not correspond to any well-defined
boundary between the mesoscales and the submesoscale.
On the other hand, the marginal stability limit of three-
dimensional destabilization could be calculated (equation
(2)) or computed for idealized anticyclones. However, this
limit depends crucially on the Ekman number. If the lat-
ter is well defined in viscous laboratory experiments, it is
not the case for the turbulent oceanic thermocline. Hence,
we plot three different stability curves which could be rel-
evant for a viscous laboratory exepriment (1
/E
k
= 1000),
an upper oceanic layer (1
/E
k
= 20,000) corresponding
to a moderate diapycnal diffusivity
κ
z
The above-mentioned experimental works show that
a uniform upstream flow which encounters an idealized
circular island may lead to a strong cyclone-anticyclone
asymmetry in the downstream wake. Either cyclonic
or anticyclonic eddies may become predominant in the
oceanic wake. These asymmetries are due to the intrinsic
dynamic properties of the flow and are mainly controlled
by three dimensionless numbers: the island Rossby num-
ber Ro
I
, the Burger number Bu, and the Ekman number
E
k
. In order to summarize these results and give a global
picture, we plot in Figure 14.9 the approximate localiza-
tion of the various dynamic regimes and the expected
cyclonic or anticyclonic predominance in the
(
Bu, Ro
I
)
parameter range. The supercritical limit is drawn with
a bold
so
lid line; it corresponds to
Fd
=
U
0
/C
=
10
−
4
m
2
/
s, or a
fully inviscid layer (
E
k
= 0). The strongest anticyclonic
destabilization and three-dimensional mixing will occur
for submesocale wakes close to the supercritical limit.
Ro
I
/
√
Bu = 1, where
C
is the maximum phase speed
of internal gravity waves. A supercritical incoming cur-
rent is unrealistic in the ocean and therefore the region
above this solid line (
Fd
14.7. FROM IDEALIZED LABORATORY FLOWS
TO COMPLEX OCEANIC WAKE
1) is forbidden. Inside the gray
area, corresponding to Ro
I
≥
0.1, the geostrophic bal-
ance should be fulfilled. In order to make a distinction
between the mesoscale (Bu
≤
These idealized laboratory experiments provide a
general understanding of the dynamic process which
impacts on deep oceanic island wake at various scales.
However, various other processes not mentionned in this
chapter may strongly impact the wake formation, the
vortex street geometry, and its dynamic behavior. There
is still a long way to reach realistic laboratory models of
complex island wakes.
We learn from this review that various three-
dimensional and ageostrophic processes are expected
to impact oceanic island wakes. Indeed, to capture
such small-scale processes, it is necessary to reach large
Reynolds numbers and avoid an excessive dissipation at
submesoscale. Therefore, realistic experiments should be
conducted on sufficiently large turntables. The limited
number of large rotating facilities, such as the 5 m
Coriolis rotating basin in Trondheim or the 13 m Coriolis
platform in Grenoble, may restrict the investigations.
Most of the experiments consider an idealized cylindri-
cal or symmetrical island to generate the wake. However,
even in the nonrotating case, an asymmetrical island coast
may induce significant differences between the oppo-
site side boundary layers. Hence, the symmetry of the
detached eddies in the near-wake flow could obviously
be broken by a realistic island coast. Few numerical
works [
Caldeira and Sangra
, 2012;
Calil et al.
, 2008;
Dong and McWilliams
, 2007] take into account the com-
plex island bathymetry and study its impact on the deep
oceanic wake. A complex archipelago will induce multi-
ple wake flows which may interact with each other [
Perret
et al.
, 2011] and strongly influence the eddy formation in
the near wake [
Caldeira and Sangra
, 2012;
Calil et al.
,
≥
1) and the submesoscale
10
Supercritical
Cyclogeostrophic
1
Cyclones
Cyclones&Anticyclones
0,1
Anticyclones
Quasi-geostrophic
and
bidimensional
Frontal geostrophic
0,0
0,01
0,1
1
Bu
10
100
Figure 14.9.
Dynamical regimes and cyclonic or anticyclonic
predominance in the (Ro
I
, Bu) parameter space. The bold solid
line corresponds to the supercritical limit
F
d
= 1, while the
horizontal dashed lines correspond to the inertial-centrifugal
stability limit (i.e., equation (2)) for
E
k
=10
−3
,5
10
−5
,0.
The dotted vertical line is an arbitrary delimitation between the
mesoscale (Bu
×
1).
The wake flow is expected to satisfy the geostrophic balance
inside the gray area.
1) and the submesoscale wake (Bu
≥