Geoscience Reference
In-Depth Information
(a)
(b)
−0.15
0.3
f
=1
f
=2
0.2
−0.2
f
=3
0.1
−0.25
−0.3
0
−0.35
−0.1
f
=1
f
−0.4
−0.2
=2
f
=3
−0.45
0
0
0.02
0.04
0.06
0.02
0.04
0.06
Δ
(rad/s)
Δ
f
(rad/s)
(c)
0.8
0.6
0.4
0.2
f
=1
f
=2
f
=3
0
0
0.02
0.04
0.06
Δ
f
(rad/s)
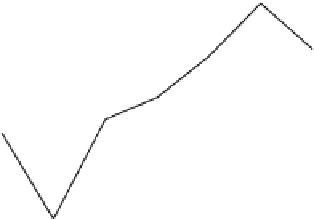
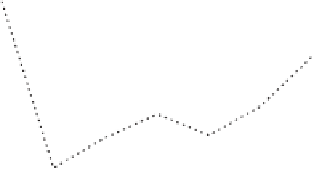
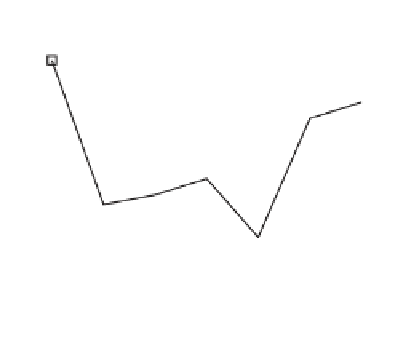
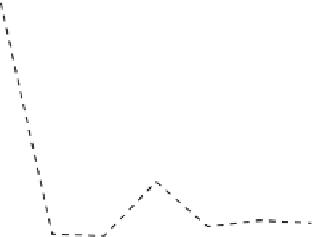
Figure 12.11.
Relative error between numerical and experimental calculations for (a) the time of wave breaking, (b) the breaking
wave length, and (c) the breaking wave amplitude.
waves take longer to break and so may be expected to
be longer than numerically computed waves advected by
the same mean flow. This may be due to a canceling effect
with the smaller amplitudes of the experimental waves (see
Section 12.6.4), which results in much shorter wavelengths
due to the small aspect of the wave envelope.
from
r
=
R
h
, between
θ
B
and
θ
B
+
L
B
. We plot
A
B
for our theory, numerical solutions, and experiments in
Figures 12.8c, 12.9c, and 12.10c, respectively.
In this case there is a contrast between the amplitudes
predicted by the nonlinear shelf wave theory and the
numerical solutions. In Figure 12.8c,
A
B
is largest for
swift coastal currents (large
f
) and weak background
rotation (small
f
) and vice versa. Figure 12.9c exhibits
a similar pattern when the coastal current is weak, but
for sufficiently large
f
we find that
A
B
instead increases
with
f
. This reflects the action of two competing effects
on the amplitude of the wave envelope: Stronger relative
vorticity within the wave envelope drives a stronger flow
onto the shelf but also induces breaking more rapidly (see
Section 12.6.2). The former is poorly represented in our
12.6.4. Amplitude at Breaking
Lastly, we analyze the amplitudes of the waves at the
point of breaking. This is directly relevant to the cross-
slope exchange of ocean waters, as it serves as a measure
of the volume transported onto the shelf due to advection
past the protrusion. We define the breaking amplitude
A
B
as the largest radial extent of the wave envelope, measured