Geoscience Reference
In-Depth Information
(a)
(b)
0.3
0.3
0.25
0.25
0.2
0.2
Vorticity (s
-1
)
0
0.05 m s
-1
-10
10
0.001 m s
-1
0.15
0.15
3.8
3.85
3.9
3.95
4.0
4.05
3.8
3.85
3.9
3.95
4.0
4.05
x
(m)
x
(m)
(c)
(d)
0.3
0.3
0.25
0.25
0.2
0.2
Density (kg m
-3
)
1040
0.05 m s
-1
1030
1050
0.15
0.15
3.8
3.85
3.9
3.95
4.0
4.05
3.8
3.85
3.9
4.0
4.05
3.95
x
(m)
x
(m)
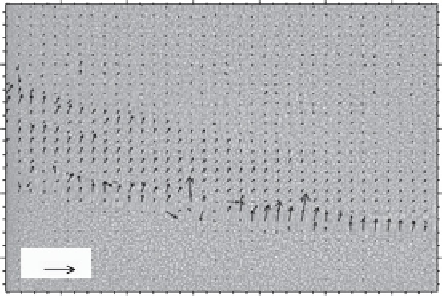
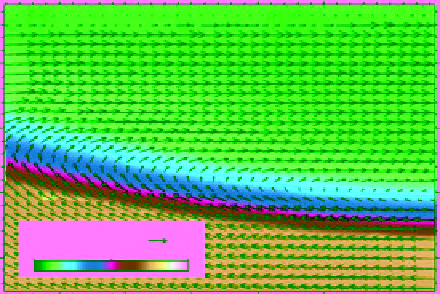
Figure 10.15.
Combined PIV-schlieren examination of the passage of an internal solitary wave of depression in an approximately
two-layer fluid. (a) Original velocity field computed using PIV superimposed on vorticity. (b) Apparent velocity resulting from
distortions at density interface superimposed on background image of random dots. (c) Corrected displacements that account for
strong density gradient at the interface superimposed on false color image of particles in the tank. (d) Corrected velocity field
superimposed on contours of density. Reproduced from Figure 12 of
Dalziel et al.
[2007]. For color detail, please see color plate
section.
displacements were not so large as to require corrections
based upon schlieren.
An example of the use of PIV to measure internal
wave amplitudes is shown in Figure 10.16. Here the
color contours and arrows show the relative velocity field
associated with internal waves generated when a Gaussian
hill oscillated horizontally back and forth with maximum
speed
U
. These are represented in a frame of reference
moving with the hill, being equivalent to maximum flow
rightward over the hill. In experiments (top images),
the velocity could only be measured to the right of the
hill. The structure of the beam is well reproduced by
simulations (middle images) and theory, which predicts
the far-field behavior (bottom images). This is true in
subcritical cases (right), for which the slope of the wave
beam is larger than the maximum slope of the hill, and
in supercritical cases (left), for which the wave beam is
tangent to the hill near its crest. The simulated amplitudes
are smaller than what is observed, however. This can
be attributed, in part, to the difficulty in capturing the
viscous-dominated processes that occur in the generation
region where the flow due to the waves moves along the
hill slope. Coupling the nearly inviscid far-field dynamics
with the viscous boundary layer dynamics remains an
outstanding theoretical challenge.
10.5.2. “Fluo-Line” Technique
Laser-induced fluorescence is now frequently used in
laboratory experiments to measure concentrations of
fluorescent dye in the plane of a laser light sheet.