Geoscience Reference
In-Depth Information
(b)
(a)
(s
-2
)
(cm)
2
Δ
z
-0.02
0
0.02
Δ
N
-0.15
0
0.15
15
15
10
10
5
5
0
0
0
0
5
10
15
20
25
5
10
15
20
25
r
(cm)
x
(cm)
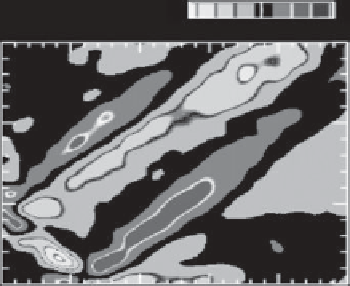
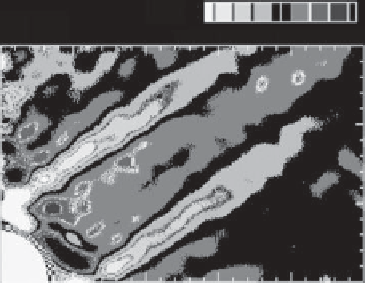
Figure 10.11.
(a) Apparent vertical displacement
z(x
,
z)
of horizontal lines in an image behind a tank in which a sphere (situated
to the bottom left) oscillates in uniformly stratified fluid. (b) Corresponding change in squared buoyancy frequency
N
2
(r
,
z)
due
to internal waves computed through axisymmetric synthetic schlieren. Adapted from Figures 2b and 4a of
Onu et al.
[2003].
signal does not weaken with distance away from the
source. Indeed, the value of
z
in Figure 10.11a is largest
near the top right-hand corner of the image. Hence,
schlieren can extract signals over noise where in situ
probe measurements or attempts to observe the motion
of embedded particles might fail.
Since the development of the technique, it has been used
to measure the laminar wake behind a falling sphere [
Yick
et al.
, 2007] and internal waves above a plume in a strati-
fied fluid [
Ansong and Sutherland
, 2010]. The latter case
provided a model for internal wave generation by con-
vective storms through the mechanical oscillator effect, in
which the repeated rise and descent of cloud tops provide
a forcing similar to that of an oscillating body.
Two approaches have since been taken to apply
tomographic methods for the measurement of internal
waves using synthetic schlieren. The Fourier-convolution
approach of
Faris and Byer
[1988] and
Goldhahn and
Seume
[1988] was used by
Hazewinkel et al.
[2011] in
their study of internal wave attractors in a parabolic
basin. The experiment itself was an extension of ear-
lier studies into the formation of internal wave beams in
spanwise-uniform, nonrectangular domains [
Maas et al.
,
1997;
Hazewinkel et al.
, 2008]. Because internal waves at
a given frequency propagate at a fixed angle to the ver-
tical, sloping sidewalls in the domain tend to focus the
disturbances into a beam whose path effectively acts as an
“attractor” for internal waves [
Maas and Lam
, 1995].
When a sphere was oscillated in stratified fluid within a
paraboloidal basin, looking through the tank at different
angles around the horizontal revealed attractor-like pat-
terns in the observed displacement of images behind the
tank. Four such images are shown in Figure 10.12. The
information in these and several more images taken at dif-
ferent perspectives were combined through a convolution
of their Fourier decompositions. The inverse transform of
the result revealed the three-dimensional structure of the
attractor, as shown in Figure 10.13.
A different approach follows that of the matrix inver-
sion method used to measure axisymmetric disturbances
[
Decamp et al.
, 2008]. At a fixed vertical level the observed
image displacements could be represented by a vector with
2
n
entries, in which
n
is the number of pixels and the
value is doubled to account for horizontal as well as ver-
tical displacements. The perturbation density field (from
which the density gradient is computed) could be dis-
cretized either in Cartesian or polar coordinates involving
N
10.4.2. Inverse Tomography
If the disturbance is fully three dimensional, then the
problem of using synthetic schlieren to reconstruct the
density gradient field from observed displacements of a
single image is ill posed: Without invoking symmetry, it is
impossible to reconstruct a three-dimensional object from
its shadow. With multiple perspectives, however, it is pos-
sible to reconstruct and approximate the structure of the
disturbance. In the medical use of magnetic resonance
imaging (MRI), the method of tomographic reconstruc-
tion is well established. Making use of refractive index
variations with air temperature, tomographic inversion
has been used to measure the density of a supersonically
expanding jet [
FarisandByer
, 1988] and of two interacting
jets [
Goldhahn and Seume
, 1988]. The latter was the first to
employ the methodology of synthetic schlieren, recording
the apparent displacement of an image of random dots,
to determine the displacement of light rays.
≡
n
x
×
n
y
or
N
≡
n
r
×
n
θ
points, respectively. For