Geoscience Reference
In-Depth Information
(a)
(b)
w
(m/s) × 10
-3
1
∣
w
l
∣
ω
S
ω
L
0.5
3
0.8
R
2
0.4
I
1
0.6
0.3
0
0.4
-1
0.2
-2
T
0.2
0.1
-3
0
0
0.5
N
1 0
0.1
0.2
0.3
0.4
0.5
50
100
(rad/s)
x
(m)
(m
-1
)
k
z
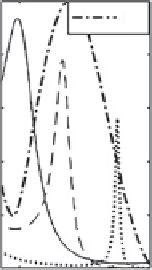
Figure 10.9.
Schlieren image (color) showing the vertical velocity field associated with incident internal waves in nonuniformly
stratified media partially transmitting (indicated by T) and reflecting (indicated by R) with partial trapping in a region of locally
enhanced stratification for 0.27m
0.33m. The profile of the background stratification is shown on the left and transmission
spectra are shown on the right for waves with frequencies indicated as the vertical lines through the buoyancy frequency profile
shown (a). Adapted from Figure 3 of
Mathur and Peacock
[2010].
z
image displacements leftward of center. Thus, comparing
right and left gives a check on the accuracy of the assump-
tion that the disturbance field was indeed axisymmetric.
Of course, the process of computing
N
2
at a particular
height can be repeated at different heights so as to recon-
struct a “snapshot” of
N
2
(r
,
z)
. If the image is of dots
instead of lines, one can compute horizontal as well as
vertical components of the density gradient through this
methodology.
An early application of axisymmetric schlieren exam-
ined the internal wave field surrounding a vertically oscil-
lating sphere in uniformly stratified fluid [
Onu et al.
, 2003;
Flynn et al.
, 2003]. For example, Figure 10.11a shows the
observed apparent vertical displacement of an image once
the sphere had oscillated three times. No data were com-
puted in the lower left-hand corner where the image was
obscured by the sphere. The corresponding
N
2
field is
shown in Figure 10.11b. As anticipated by theory, the
along-beam amplitude decayed rapidly with distance from
thecenterof thesphereastheconicalwavebeamexpanded
radially about the
z
axis. The theory predicted well the
amplitude of the wave cones provided the sphere was suf-
ficiently small (of radius 1.9 cm). But in experiments with
a sphere of radius 3.2 cm, theory overpredicted the ampli-
tude of the
N
2
field by as much as double, presumably
becauseitneglecteddynamicsoccurringwithintheviscous
boundary layer surrounding the sphere [
Flynnetal.
, 2003].
This observation reveals a particularly useful aspect of
the use of schlieren. Although the amplitude decays, the
horizontal extent of the disturbance widens with distance
from the origin. As a result, the vertical displacement
Δ
z
(0)
Δ
z
(
dx
)
Δ
z
(2
dx
)
2
)
2
(Δ
N
2
)
1
(Δ
N
2
)
0
(Δ
N
dy
00
dy
11
dy
22
dy
01
dy
12
y
dy
02
2
= 0
Δ
N
x
−2
dx
−
dx
0
dx
2
dx
Figure 10.10.
Discretization used to represent apparent dis-
placements in an image behind a tank to axisymmetric dis-
turbances within the tank. The disturbances are represented
in terms of changes to the squared buoyancy frequency
N
2
,
which is assumed constant on annuli of width
dr
=
dx
,inwhich
dx
is the horizontal (e.g., pixel) resolution of the observed
vertical displacements
z
of the object image.