Geoscience Reference
In-Depth Information
it is now possible to make nonintrusive measurements
of velocity and concentration in two and even three
dimensions. These tools have provided new insights into
problems involving turbulence and mixing that remain a
challenge in computational fluid dynamics.
However, the study of stratified fluids remains an exper-
imental challenge because light typically refracts differ-
ently through fluids of varying density. This can distort
and smear the apparent positions of particles used in PIV
and so lead to spurious predictions of flow speeds. On
the other hand, the very fact that density and refractive
index are related has provided other means to examine
nonintrusively the structure of stratified fluid flow.
One visualization tool used in laboratory experiments
of salt-stratified fluids is the shadowgraph. In this, a light
source placed far behind the test section shines through
the stratified fluid landing upon a translucent surface such
as Mylar. At interfaces where the density rapidly changes,
the light focuses and defocuses as it bends relatively more
or less while passing through fluid of varying salinity and,
hence, varying refractive index. If density variations due
to internal waves are gradual, focusing may not be evi-
dent. The shadowgraph proves particularly useful in the
examination of approximately two-layer fluids, in which
case light focusing at the interface can be used to track
the motion of interfacial waves. For internal waves in uni-
formly stratified fluid, the shadowgraph is particularly
effective in the examination of waves that are close to
breaking, as shown in Figure 10.1. In this experiment
[
Koop and McGee
, 1986], sinusoidal topography is towed
leftward beneath a shear flow whose speed increases left-
ward with height. At middepth in the experiments the
waves encounter a critical level, where the background
flow speed is close to the towing speed of the hills.
Another method taking advantage of the relationship
between refractive index and density is called “schlieren”
[
Schardin
, 1942;
Settles
, 2001]. In the traditional
approach, light reflected from a parabolic mirror passes
through a test section before striking a second parabolic
mirror that refocuses the light. A knife edge at the focus
acts as a filter on spurious signals, thus revealing index-
of-refraction-dependent structures within the test section.
Mowbray and Rarity
[1967] were the first to use tra-
ditional schlieren methods to visualize internal waves
generated by a cylinder oscillating at a fixed frequency,
ω
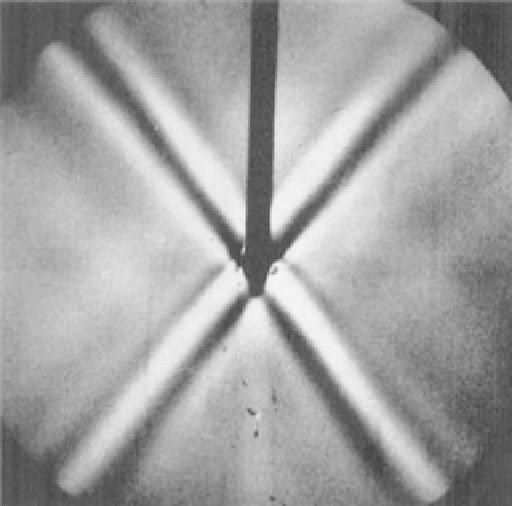
. Provided
ω
was sufficiently small, they observed that
the waves emanated vertically and horizontally from the
cylinder in a cross pattern, as shown in Figure 10.2.
In this experiment, the fluid was a uniformly stratified
salt solution whose density decreased linearly with height.
The stratification can be represented by the buoyancy
frequency
N
, defined in the Boussinesq approximation by
Figure 10.1.
Internal wave breaking near a critical layer as
visualized by shadowgraph. Reprinted from Figure 7 of
Koop
and McGee
[1986].
Figure 10.2.
Pattern of internal waves generated by an oscillat-
ing cylinder as visualized by conventional schlieren methods.
Reproduced from Plate 1(6) of
Mowbray and Rarity
[1967].
Here
ρ(z)
is the ambient density,
ρ
0
is the characteristic
density (e.g., that for fresh water at room temperature),
and
g
is the acceleration of gravity. In agreement with the
predicted dispersion relation of internal waves,
Mowbray
¯
¯
g
ρ
0
d
ρ
dz
.
N
2
=
−
(10.1)