Geoscience Reference
In-Depth Information
(a)
(b)
10
0
10
0
10
-2
10
-2
10
-4
10
-4
0.11
0.069
0.043
0.032
0.023
0.017
0.046
0.032
0.022
0.016
0.011
0.0081
10
-6
10
-6
10
-8
10
-8
10
-10
10
-10
10
0
10
1
10
2
10
3
10
0
10
1
10
2
10
3
k
h
/
∆
k
k
h
/
∆
k
(c)
10
0
10
-2
10
-4
0.020
0.014
0.0097
0.0069
0.0044
0.0034
10
-6
10
-8
10
-10
10
0
10
1
10
2
10
3
k
h
/
∆
k
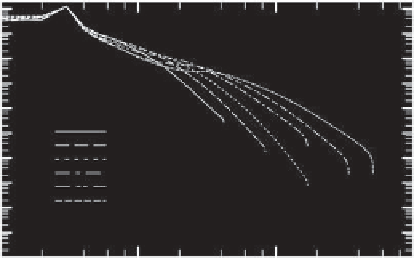
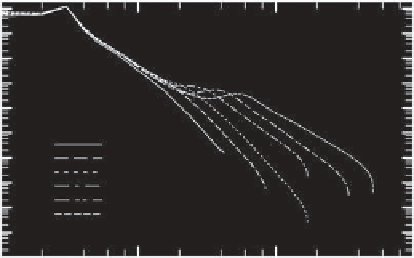
Figure 8.3.
Horizontal wave number spectra of kinetic energy in simulations with Re
b
≈
(a) 2, (b) 0.6, and (c) 0.2 (simulation
sets A, B, and C). Dash patterns denote different Fr
h
.
(a)
(b)
-1.0
-1.0
-2.0
-2.0
-3.0
-3.0
-4.0
-4.0
-5.0
-5.0
-6.0
-6.0
10
-3
10
-2
10
-1
10
0
10
2
10
3
10
4
10
5
Fr
Re
h
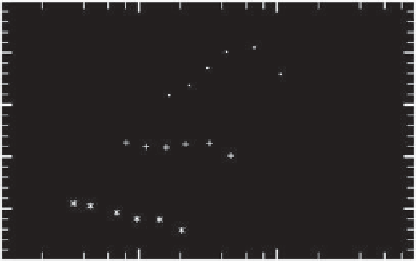
Figure 8.4.
Spectral slopes of the horizontal wave number spectra of kinetic energy, plotted vs. (a) Fr
h
and (b) Re for Re
b
≈
2(
·
),
0.6 (
+
), and 0.2 (
∗
) (simulation sets A, B, and C).
forcing (potential energy is not directly forced in these
simulations), while
D
K
(k
h
)
and
D
P
(k
h
)
are the viscous
and diffusive dissipation of kinetic and potential energy.
These dissipation terms include the contributions from
both horizontal and vertical gradients, and so their effects
are not necessarily dominated by large
k
h
, as in a typical
dissipation range at large Re.
Figure 8.5 shows the transfer and buoyancy flux spec-
tra from three simulations with the same stratification
Fr
h
≈
0.02 and different Re. Dissipation and forcing