Geoscience Reference
In-Depth Information
110
110
100
100
90
90
80
80
70
70
60
60
50
50
40
40
30
30
20
20
10
10
0
0
-10
0
10
20
30
40
50
60
70
-10
0
10
20
30
40
50
60
70
110
110
100
100
90
90
80
80
70
70
60
60
50
50
40
40
30
30
20
20
10
10
0
0
-10
0
10
20
30
40
50
60
70
-10
0
10
20
30
40
50
60
70
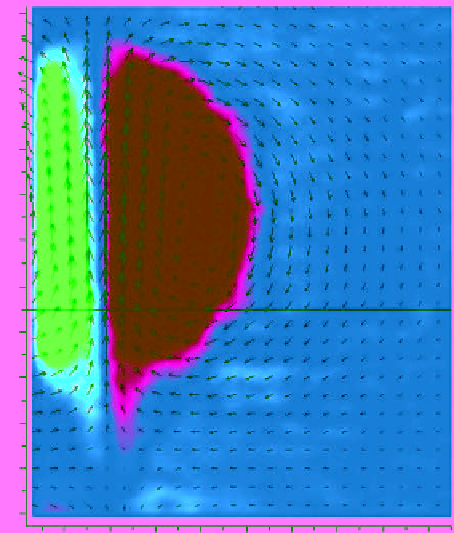
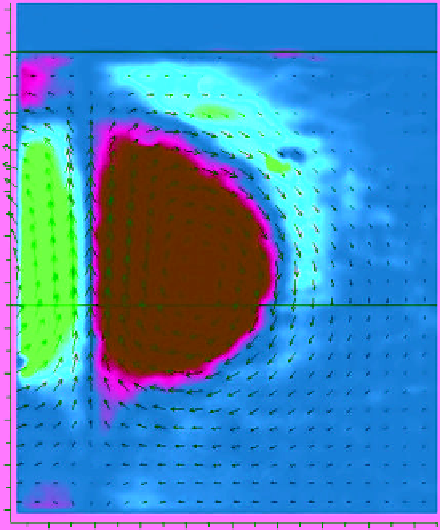
Figure 7.8.
Experimentally measured flow evolution of a dipolar vortex encountering a weak slope topography with angle
α
=3.4
◦
(left panels) and a steeper slope with inclination
α
=6.8
◦
(right panels). Adapted from
van Heijst et al.
[2012]. The snapshots
are taken at
t
= 3 s (top) and
t
= 9 s (bottom). The graphs show the horizontal flow field (vectors) and the
ω
z
vertical vorticity
component (red/blue colors indicate positive/negative values) measured at the free surface. The horizontal black lines indicate
the position of the edge of the slope. For color detail, please see color plate section.