Geoscience Reference
In-Depth Information
1
(
c
)
10
1
0.9
Outcropping
0.8
(
b
)
0.7
10
0
0.6
0.5
(
a
)
0.4
10
-1
0.3
(
d
)
0.2
0.1
10
-2
10
-2
0
10
-1
10
0
Bu
10
1
10
2
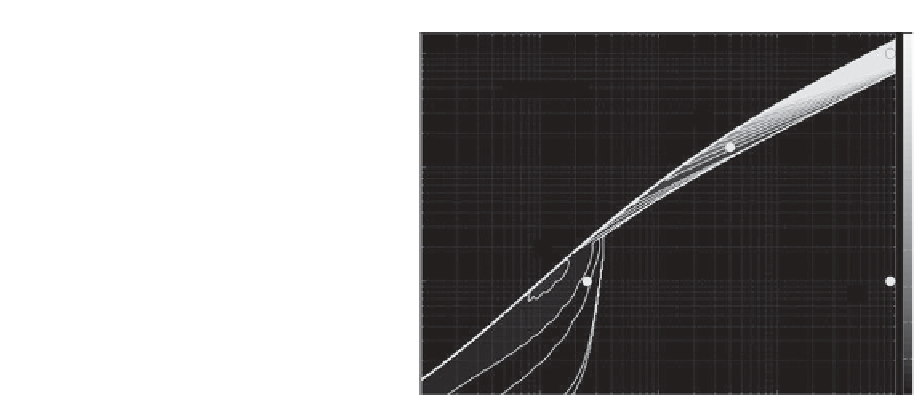
Figure 6.2.
Growth rate of most unstable modes in (Ro, Bu) space. Darker zones correspond to higher growth rates. Contours
displayed are 0.001, 0.01, 0.02 and further interval at 0.02. The thick upper frontier line marks the outcropping limit when the
interface between the two layers intersects the bottom or the top. Adapted from
Gula et al.
[2009b].
30
(
c
)
10
1
Outcropping
25
(
b
)
20
10
0
15
(
a
)
10
10
-1
(
d
)
5
10
-2
10
-2
0
10
-1
10
0
10
1
10
2
Bu
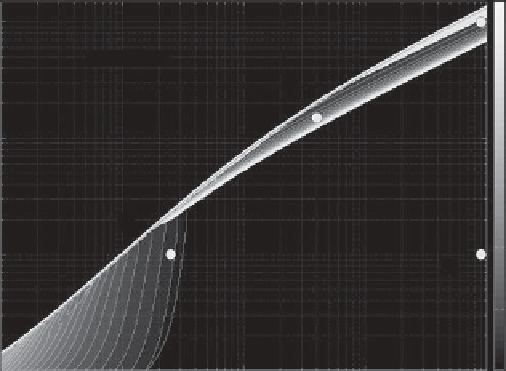
Figure 6.3.
Wave number of most unstable modes in (Ro, Bu) space corresponding to Figure 6.2. Darker zones correspond to
higher wave numbers. The interval between subsequent contours is 1. Adapted from
Gula et al.
[2009b].
similar to the classical Kelvin-Helmholtz (KH) instability
[
Paldor and Ghil
, 1991]. Note that although KK, Kelvin-
Poincaré (KP), and Poincaré-Poincaré (PP) resonances
are physically different, they are frequently confused in
the literature and appear under the general name of KH
instability. Similarly RK and RP instabilities are often
both called RK [cf.
Sakai
, 1989]. We follow this simplified
convention.
In the context of wave resonances, there are three essen-
tial parameters in the problem:
V
=
r
0
, the velocity
(or velocity shear) of the basic flow;
C
R
=
H/H
0
r
0
,
the charac
teris
tic phase velocity of the Rossby waves; and
C
G
=
g
H
0
, the characteristic phase velocity of the
gravity waves. The interpretation of the results may be
done on the basis of the alternative set of nondimensional
parameters defined as
F
∗
=
V
C
G
=
r
0
g
H
0
,