Geoscience Reference
In-Depth Information
0
321
-0.5
-1
-1.5
0
10
20
y
, cm
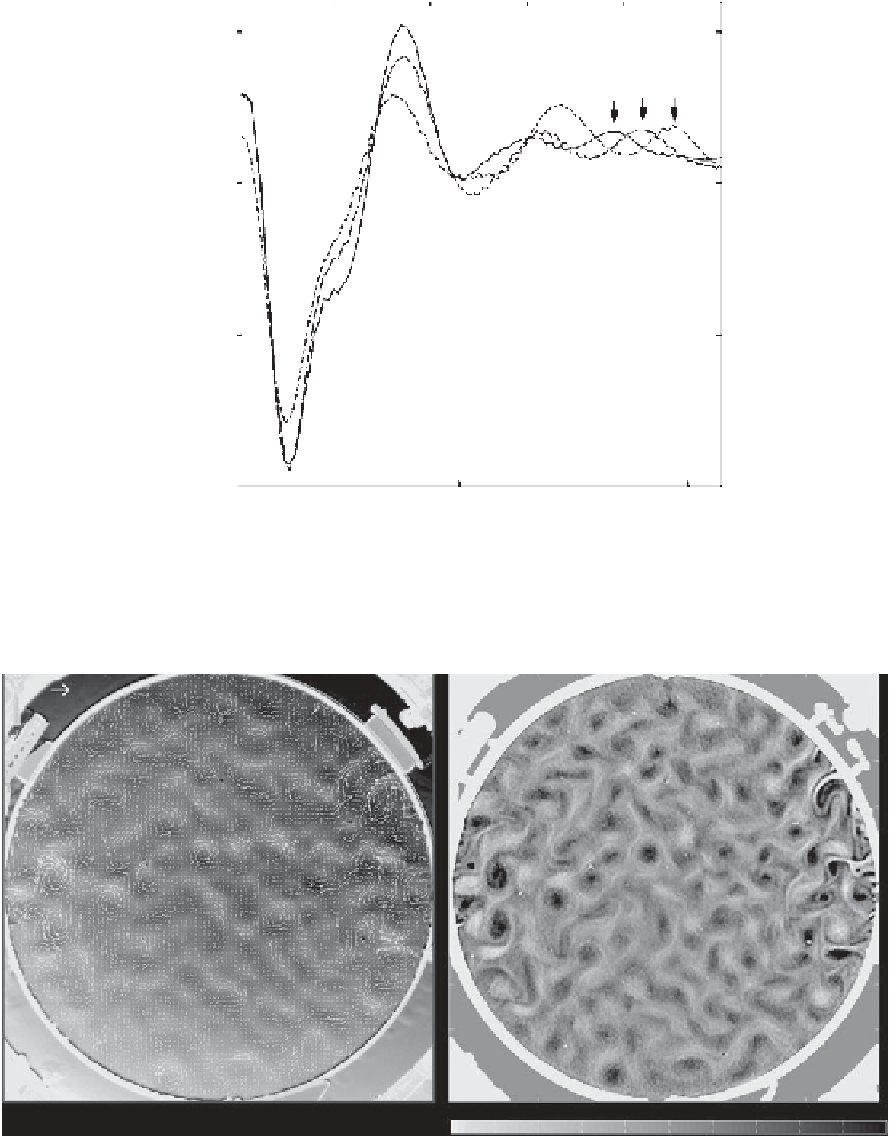
Figure 5.9.
Profiles of the
x
component of the velocity measured along the
y
axis near the wall of the tank. The time interval
between the profiles is 0.5 s. The high values of velocity near the wall are due to the coastal current, and the low-amplitude peaks
away from the wall are indicative of inertial waves. Arrows 1-3 indicate the propagation of the crest of the wave toward the wall.
(a)
(b)
5 cm/s
-0.5
-0.4 -0.3 -0.2 -0.1
0
0.1
0.2
0.3
0.4
0.5
Figure 5.10.
Continuously forced turbulent flow on the f-plane: (a) velocity vectors superposed on the altimetric image of the
flow and (b) the relative vorticity field. The gray scale shows dimensionless vorticity
ζ/f
0
.
field and horizontal electric current and drives the ions
in the horizontal direction perpendicular to the electric
current. Thus, each magnet provides a localized force on
the fluid in the horizontal direction, which generates a
vortex dipole. The dipoles induced by individual magnets
interact with each other and go through the process of
adjustment to the background rotation. A typical image
of the resulting turbulent flow is shown in Figure 5.10.
The evolution of turbulence comprises vortex formation,
translation, interaction, and decay by shear.