Geoscience Reference
In-Depth Information
(In groundwater hydrology, the terms storativity,
a function of the effective aquifer porosity, and
the hydraulic conductivity are often used).
Poro-perm cross-plots are used to perform
many functions: (a) to compare measured poros-
ity and permeability from core data, (b) to esti-
mate permeability from log-based porosity
functions in uncored wells, and (c) to model
the distribution of porosity and permeability in
the inter-well volume - reservoir property
modelling. Good
10000
1000
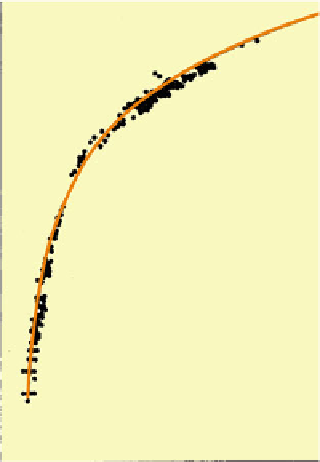
Fontainebleau sandstone
measurements (Bourbie,
& Zinszner, 1985)
Pore network model
(Bryant & Blunt 1992)
100
10
reservoir model
design
-k functions while poor
handling of this fundamental transform can lead
to gross errors. It is generally advisable to regress
permeability (the dependent variable) on poros-
ity (as the independent variable).
In general, we often observe permeability data
to be log-normally distributed while porosity
data is more likely to be normally distributed.
This has led to a common practice of plotting
porosity versus the log of permeability and
finding a best-fit function by linear regression.
Although useful, this assumption has pitfalls:
(a) Theoretical models and well-sampled
datasets show that true permeability versus
porosity functions depart significantly from a
log-linear function. For example, Bryant and
Blunt (
1992
) calculated absolute permeabil-
ity - using a pore network model - for ran-
domly packed spheres with different degrees
of cementation to predict a function
(Fig.
3.19
) that closely matches numerous
measurements of the Fontainebleau sand-
stone (Bourbie and Zinszner
1985
).
(b) Calculations based on an exponential trend
line fitted to log-transformed permeability
data can lead to serious bias due to a statisti-
cal pitfall (Delfiner
2007
).
(c) Multiple rock types (model elements) can be
grouped inadvertently into a common cross
plot which gives a misleading and unrepre-
sentative function.
(d) Sampling errors,
involves careful use of
ϕ
1
0.1
0.01
0
0.1
0.2
0.3
Porosity
Fig. 3.19
Pore-network model of a porosity-
permeability function closely matched to data from the
Fontainebleau sandstone
particular recommends using a permeability esti-
mator based on percentiles - Swanson's mean.
Swanson's mean permeability, k
SM
, for a given
class of porosity (e.g. 15-20 %) is given by:
k
SM
¼
0
:
3X
10
þ
0
:
4X
50
þ
0
:
3X
90
ð
3
:
22
Þ
where, X
10
is the tenth percentile of the perme-
ability values in the porosity class.
The resulting mean is robust to the log-linear
transform and insensitive to the underlying dis-
tribution (log-normal or not). The result is a
significantly higher k
mean
than obtained by a
simple trend-line fit through the data.
Figure
3.20
illustrates the use of the k-
trans-
form within the Data
6
¼ Model
6
¼ Truth para-
digm. True pore systems have a non-linear
relation between porosity and permeability,
depending on the specific mechanical and chem-
ical history of that rock (compaction and diagen-
esis). We use the Fountainebleau sandstone trend
to represent the “true” (but essentially unknown)
k-
ϕ
including application of
cut-offs,
lead to false conclusions about
the
correlation
between
porosity
and
ϕ
permeability.
Delfiner (
2007
) reviews some of the important
pitfalls in the k-
relationship (Fig.
3.20a
). Core data may, or
may not, give us a good estimate of true relation-
ship between porosity and permeability, and the
ϕ
transform process, and in