Geoscience Reference
In-Depth Information
Model
Data
Truth
Model 2
Data
Reservoir
(ground truth)
Model
Model 3
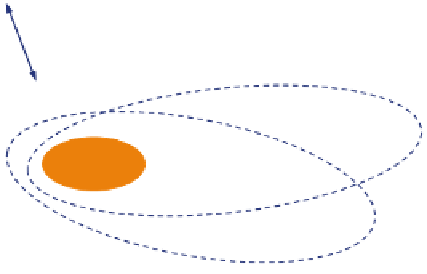
Fig. 3.14
Illustration of the axiom: Data
6
¼ Model
6
¼ Truth (Redrawn from Corbett and Jensen
1992
,
EAGE
#
reproduced with kind permission of EAGE Publications B.V., The Netherlands)
Our overall aim in reservoir modelling is to
estimate and compare distributions for:
1. The well data (observations);
2. The reservoir model (a hypothesis or postulate);
3. The population (the unknown “true” reservoir
properties).
We must always remember not to confuse
observations (data) with the model (a hypothesis)
and both of these with the “ground truth” (an
unknown). This leads us to one of the most
important axioms of reservoir modelling:
'The previous models were all wrong, but this
one must be right because it matches all the
data we have.'
Now statement A sounds good but begs the
questions what cut-off was applied and is the
geometric average indeed the appropriate aver-
age to use? Statement B is clearly arrogant but in
fact captures the psychology of every reservoir
model builder - we try to do our best with the
available data but are reluctant to admit to the
errors that must be present. Versions of these
statements that would be more consistent with
the inequality above might be:
Data
6
¼
Model
6
¼
Truth
Of course, we want our models to be consistent
with the available data (from wells, seismic, and
dynamic data) and we hope they will give us a
good approximation of the truth, but too often the
reservoir design engineer tries to force an artifi-
cial match which leads inevitably to great disap-
pointment. A common mistake is to try to
manipulate the data statistics to obtain an appar-
ent match between the model and data. You may
have heard versions of the following statements:
'We were able to match the well test perme-
ability (k
h
) to within 10 % of the log-derived
permeability data by applying the agreed cut-
off and using a geometric average, and a
power average with p
0.3 gave us an even
better match to within 1 %.'
¼
'The previous models had several serious
errors and weaknesses, but this latest set of
three models incorporates the latest data and
captures
the likely range of
subsurface
'We matched the well test permeability (k
h
)to
the log-derived permeability data by applying
a cut-off and using a geometric average.'
behaviour.'
Figure
3.14
illustrates what the statistical
objective of modelling should be. The available