Geoscience Reference
In-Depth Information
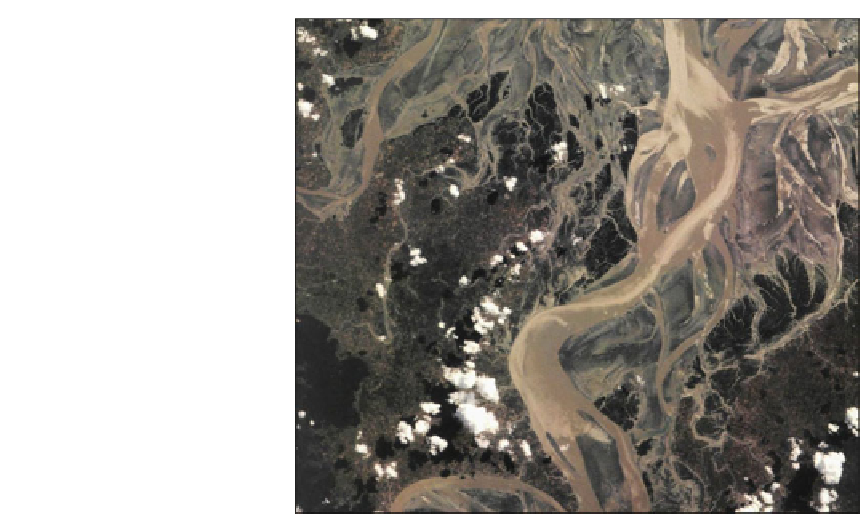
Fig. 2.26
Image of a
present-day sand system -
an analogue for lower
coastal plain fluvial
systems and tidally-
influenced deltas
(Brahmaputra Delta
(NASA shuttle image))
2.6.2 Intuitive Geostatistics
average
variance. The overall result suggests
pixel ranges of 25 in an E-W direction
(Fig.
2.30
) and 35 in a N-S direction (Fig.
2.31
),
reflecting the N-S orientation of the sand system
and a 35:25 (1.4:1) horizontal anisotropy ratio.
This example is not intended to suggest that
quantitative measures should be derived from sat-
ellite images and applied simply to reservoir
modelling: there are issues of depositional vs.
preserved architecture to consider, and for a sand
system such as that illustrated above the system
would most likely be broken down into elements
which would not necessarily be spatially modelled
using variograms alone (see next section).
The example is designed to guide our think-
ing towards an intuitive connection between
the variogram (geostatistical variance) and
reservoir heterogeneity (our concept of the var-
iation). In particular, the example highlights the
role of
averaging
in the construction of
variograms. Individual transects over the image
vary widely, and there are many parts of the sand
system which are not well represented by the
final averaged variogram. The variogram is in a
sense quite crude and the application of
variograms to either rock or property modelling
assumes it is reasonable to convert actual spa-
tial variation to a representative average and
In the discussion of key geostatistical concepts
above we have tried to make the link between the
underlying geostatistical concepts (more proba-
bilistic) and the sedimentological concepts (more
deterministic) which should drive reservoir
modelling. Although this link is difficult to define
precisely, an intuitive link can always be made
between the variogram and the reservoir archi-
tectural concept.
In the discussion below we try to develop that
link using a satellite image adopted as a conceptual
analogue for a potential reservoir system. The
image is of a wide fluvial channel complex open-
ing out into a tidally-influenced delta. Assuming
the analogue is appropriate, we extract the guid-
ance required for the model design by estimating
the variogram range and anisotropy from this
image. We assume the image intensity is an indi-
cator for sand, and extract this quantitatively from
the image by pixelating the image, converting to a
greyscale and treating the greyscale as a proxy for
'reservoir'. This process is illustrated in Figs.
2.26
,
2.27
,
2.28
,
2.29
,
2.30
,and
2.31
.
This example shows how the semivariogram
emerges from quite variable line-to-line transects
over the analogue image to give a picture of