Geoscience Reference
In-Depth Information
Nugget model
Gaussian model
1
1
g
g
0
0
distance (lag)
distance (lag)
Spherical model
Power law model
1
1
g
g
0
0
distance (lag)
distance (lag)
Exponential model
Hole model
1
1
g
g
0
0
distance (lag)
distance (lag)
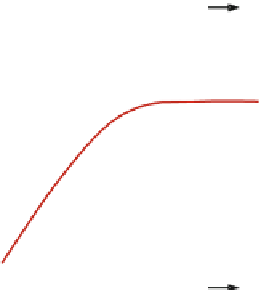
Fig. 2.24
Standard semi variogram models, with
ʳ
normalised to 1 (Redrawn from Deutsch
2002
,
#
Oxford
University Press, by permission of Oxford University Press, USA (
www.oup.com
)
)
spatially more heterogeneous. The presence of a
nugget means that although the dataset displays
correlation, quite sudden variations between
neighbouring points can occur, such as when
gold miners come across a nugget, hence the
name. The nugget is also related to the sample
scale - an indication that there is variation at a
scale smaller than the scale of the measurement.
There are several standard functions which
can be given to semivariogram models, and
which appear as options on reservoir modelling
software packages. Four common types are
illustrated in Fig.
2.24
. The spherical model is
probably the most widely used.
A fifth semivariogram model - the power
law - describes data sets which continue to
get more dissimilar with distance. A simple
example would be depth points on a tilted
surface or a vertical variogram through a data
set with a porosity/depth trend. The power law
semivariogram has no sill.
It should also be appreciated that, in general,
sedimentary rock systems often display a 'hole
effect' when data is analysed vertically
(Fig.
2.24e
). This is a feature of any rock system
that shows cyclicity (Jensen et al.
1995
), where
the
ʳ
value decreases as the repeating bedform is
encountered. In practice this is generally not
required for the vertical definition of layers in a
reservoir model, as the layers are usually created
deterministically from log data, or introduced
using vertical trends (Sect.
2.7
).