Geoscience Reference
In-Depth Information
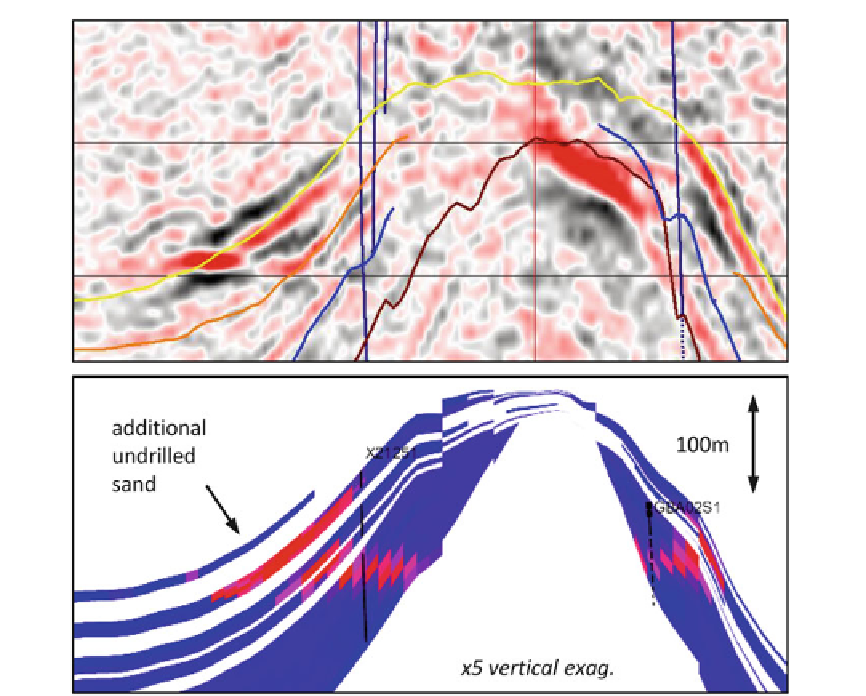
Fig. 6.26
Top
: amplitude change after 5 years of produc-
tion in gravity flows onlapping a salt dome;
bottom
:
forward-modelled acoustic impedance change in the
sand-rich layers, including an additional upper layer not
seen in the wells (Bentley and Hartung
2001
) (Redrawn
from Bentley and Hartung
2001
,
#
EAGE reproduced
with kind permission of EAGE Publications B.V., The
Netherlands)
An important error occurs if the core plug data is
not sampling an REV, which tends to be the case
in very finely laminated intervals. The resulting
permeability values inserted into model cells are
somewhat meaningless numbers, which are then
upscaled for simulation. The resulting simulation
forecasts are unlikely to be useful.
A less error-prone workflow is illustrated in
Fig.
6.28
, in which the key step is to decouple the
handling of porosity and permeability. The poros-
ity log may not reflect the porosity of the thin net
reservoir beds correctly, but it may be a reason-
able average of porosity in the net/non-net pack-
age. The logging tool is effectively measuring an
upscaled porosity, which can be applied to a cell
with N/G
the pore volume. The validity of this can be
checked with reference to core data.
Permeability cannot be directly derived by
transforming the log-average of core values,
however, and this is where the modelling of
porosity and permeability is decoupled. Effective
permeability can instead be calculated using
small-scale modelling based on data which
samples the REVs of the small scale reservoir
in this chapter for tidal heterolithics and fine
aeolian laminae. The input data may be core
plug permeabilities, mini-permeameter data or
estimates from thin sections - whichever scale
samples the appropriate REV. The final outcome
should be checked against well test data.
¼
1 at least as a first approximation of