Geoscience Reference
In-Depth Information
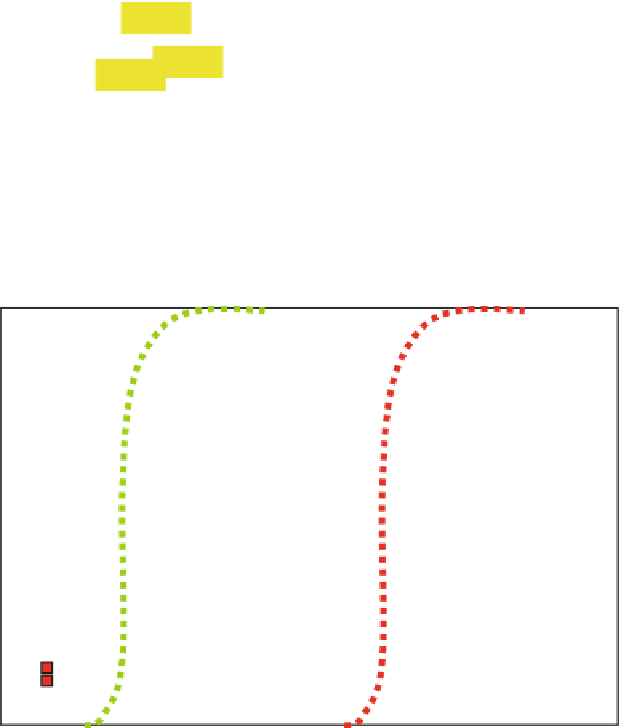
1.0
Well 1
Well 2
0.0
p
c
= 0.67
Sand fraction (p)
Fig. 6.13
Illustration of the sand connectivity and effective permeability using percolation theory
100
80
Increasing 2D effect
60
40
20
0
20
40
60
80
Sand Fraction (N/G, %)
Fig. 6.14
Connectivity as a function of channel sand-
stone fraction (N/G), for a wide range of stochastic 3D
channel models (Redrawn from Larue and Hovadik
2006
). Sinuous channels (
green
) show characteristic 3D
percolation behaviour, while straighter channels (
red
)
show more 2D percolation behaviour.
Yellow
and
blue
points have intermediate sinuosity (Redrawn from Larue
and Hovadik
2006
, Petroleum Geoscience, v. 12
#
Geological Society of London [2006])
connectivity behaviour of the system at hand. A
simple reference point is that a reservoir with
sand volume fraction of around 0.25 would be
expected to be close to the percolation threshold
(in 3D) and therefore have connectivity strongly
dependent on the sand volume fraction and geo-
metrical assumptions.
Larue and Hovadik (
2006
) completed a very
comprehensive
models of channelized fluvial reservoirs
(Fig.
6.14
). They showed that actual connectivity
(measured in terms of percolation exponents)
varies enormously, depending on the details of
the channel system, especially the sinuosity. In
general, for 3D models, the rapid fall in connec-
tivity occurs at around 20 % sand fraction - a
little lower than the theoretical value of 25 % due
to sinuosity and overlap of sandstone objects.
analysis of
connectivity in