Geoscience Reference
In-Depth Information
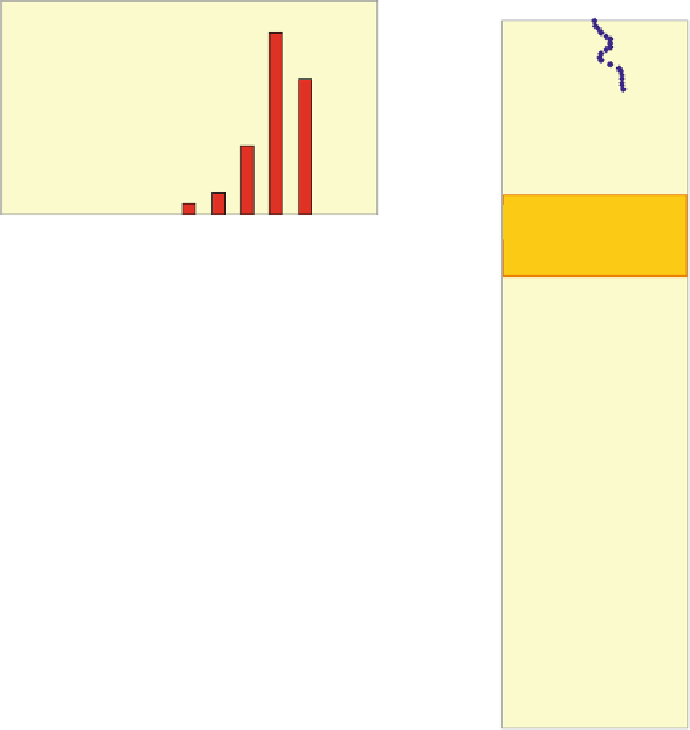
Permeability, ln(k) (mD)
Probe permeameter data
4
202468
2590
0.4
0.2
2595
0
Estuarine bar
2600
k (md)
Depth
(m)
2605
Estuarine bar core plugs
Whole interval core plugs
2610
Wireline k-estimate
Blocked wireline k
2615
2620
Fig. 4.26
Example dataset from a tidal deltaic flow unit
illustrating treatment of permeability data used in reser-
voir modelling (Redrawn from Ringrose et al.
2008
, The
Geological Society, London, Special Publications 309
#
Geological Society of London [2008])
Table 4.2
Variance analysis of example permeability dataset
Estuarine bar lithofacies
Whole interval (flow unit)
(b) Probe data
upscaled to plug
scale
(e)
Wireline-k
estimate
(f)
Blocked
well data
(c) Core plug
data
(d) Core
plug data
(a) Probe-k data
Scale of data
10
10 cm;
2 mm spaced
data
2
2 cm squares
of 2 mm-spaced
data
c.15-30 cm
spaced core
plugs
c.15-30 cm
spaced plugs
15 cm
digital log
2m
blocking
N
¼
2,584
25
11
85
204
16
Mean ln(k)
7.14
7.14
6.39
1.73
2.32
2.17
2
ln(k)
˃
0.38
0.30
0.99
8.44
5.94
4.80
Variance
adjustment
factor,
f
-
0.79
-
-
-
0.81