Geoscience Reference
In-Depth Information
Upscaled Relative Permeability
1.0
0.8
k
rox
0.6
k
rwx
0.4
k
rwz
k
roz
0.2
0
Example Rock Curves
0
0.2
0.4
0.6
0.8
1.0
2.0
Sw
Pc Rock 1
krw Rock 1
kro Rock 1
Pc Rock 2
krw Rock 2
kro Rock 2
1.8
1.6
1.4
1.2
1.0
0.8
0.6
0.4
Upscale
0.2
0.0
0.0
0.2
0.4
0.6
0.8
1.0
Sw
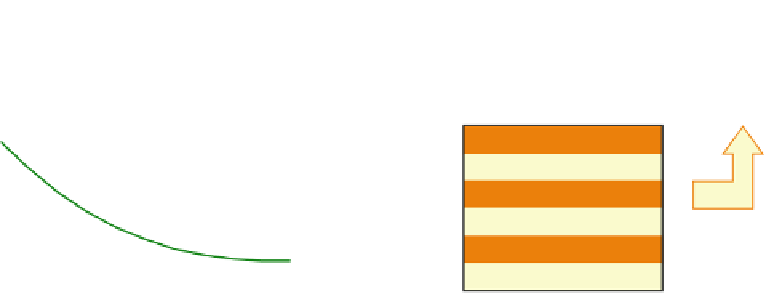
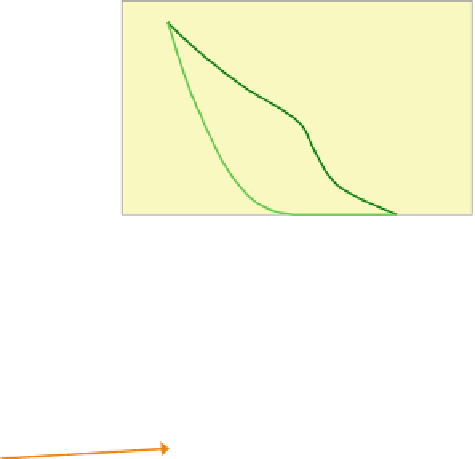
Fig. 4.11
Capillary equilibrium steady-state upscaling method applied to a simple layered model
applied resulting in a vertical trend in the
saturation at any chosen pressure reference.
The GCE solution should tend towards the
CE solution as
4. Find the phase permeabilities, e.g. k
o1
¼
k
1
*
k
ro1
;
5. Calculate the upscaled permeability for each
direction and for each phase using the arith-
metic and harmonic averages;
6. Invert back to upscaled relative permeability,
e.g. k
ro1
¼
the length-scale becomes
increasingly small.
All three steady-state methods involve a series
of independent single-phase flow calculations and
therefore can employ a standard single-phase
pressure solver algorithm. The methods can there-
fore be rapidly executed on standard computers.
The capillary equilibrium method can be eas-
ily calculated for a simple case, as illustrated in
Figure
4.11
by an example set input functions for
a regular layered model. Upscaled relative per-
meability curves for this simple case can be cal-
culated analytically (using a spreadsheet or
calculator). The method uses the following
steps (refer to Fig.
4.9
):
1. Chose a value for pressure, P
c1
;
2. Find the corresponding saturation value, S
w1
;
3. Determine the relative permeability for oil
and water for each rock type, k
ro1
,k
rw1
,k
ro2
,
k
rw2
;
k
o1
/k
upscaled
(once again the arith-
metic and harmonic averages are used to
obtain the upscaled absolute permeability);
7. Repeat for next value pressure, P
c2
.
Note that the upscaled curves are highly aniso-
tropic, and in fact sometimes lie outside the range
of the input curves. This is because of the effects
of capillary forces - specifically capillary trapping
when flowing across layers. Capillary forces result
in preferential imbibition of water (the wetting
phase) into the lower permeability layers, making
flow of oil (the non-wetting phase) into these low
permeability layers even more difficult.
These somewhat non-intuitive effects of capil-
lary pressure in laminated rocks can be demon-
strated experimentally (Fig.
4.12
). In the case of
two-phase flow across layers in a water-wet