Geoscience Reference
In-Depth Information
both the locations of oaks and the set of random points within the res-
caled plot, Figure 6.3 shows the corresponding points for hickories, and
Table 6.2 gives the results from Hines and O'Hara Hines's (1979) test of
randomness, based on the critical values given in Table 6.1.
T−square sampling. Hickories in Lansing Woods ( n = 25 )
^
D
T
= 504.57
1.0
25
15
10
20
24
5
0.8
4
14
9
23
0.6
18
19
Y
13
3
8
0.4
22
2
12
7
0.2
17
21
11
1
6
16
0.0
0.0
0.2
0.4
0.6
0.8
1.0
95% CI for DT
T
= [368.78,798.63]
X
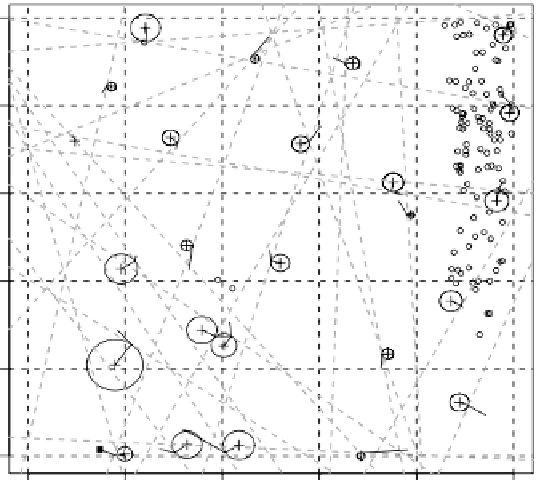
FIGURE 6.3
T
T-square sampling of hickories in Lansing Woods. Twenty-five points (+) in a 5 × 5 grid were
randomly positioned in the unit square, and the nearest hickories to the random points (the
point on each circle) were located. The filled squares indicate the nearest hickories to the for-
mer nearest hickories. Byth's estimate of the density
D
ˆ
T
and the 95% confidence interval for
D
T
are also shown.
TABLE 6.2
Density Estimation of Oaks and Hickories in Lansing Woods Produced by
T
-Square
Sampling of
n
= 25 Random Points in a 5
×
5 Grid
Hines and
O'Hara Hines
Statistic
h
T
Byth's Estimated
Density
D
ˆ
T
95% Confidence
Interval for
D
T
Actual Density
D
T
(Unit Square)
Species
Oaks
1.25
a
928.83
[694.25, 1402.86]
929
Hickories
1.40
b
504.57
[368.78, 798.63]
514
a
Nonsignificant departure from a random pattern,
p
> 0.05.
b
Significant departure from a random pattern in the direction of an aggregated pattern,
0.01 <
p
< 0.025.