Geoscience Reference
In-Depth Information
70
60
50
40
30
20
10
0
-10
1
2
3
4
5
6
Day
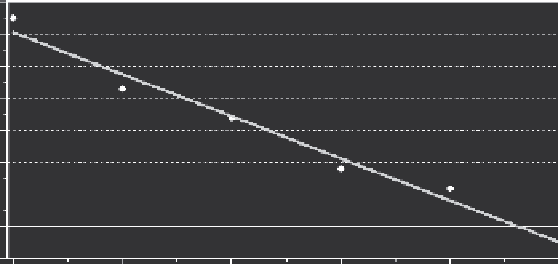
FIGURE 5.1
How the removal method reduces the population as more fish are removed from the popula-
tion on each day. The observed numbers removed are shown for each day (•), and the line is a
linear regression fitted to these numbers. The regression line suggests that on day 5 there were
about eight fish left in the population. The estimated total population size was therefore about
65 + 43 + 34 + 18 + 12 + 8 = 180.
standard error 9.9, suggesting that on day 5 there were 24 animals left in the
study area.
For a second example, assume that the assumptions hold, the popula-
tion size is
N
= 100, and 20% of the remaining population is expected to be
caught on each occasion. The expected size of the catch on the first occasions
is
z
1
= 20. On the second occasion, 20% of the remaining 80 or
z
2
= 16 animals
are expected to be captured. On the third occasion, the model predicts that
z
3
= 12.8 animals would be captured. This is an impossible value, so sample
data and modeled values cannot agree exactly. Still, continuing, the expected
catch sizes on the fourth and fifth occasions are
z
4
= 10.24 and
z
5
= 8.192, respec-
tively. At the end of five capture occasions, the expected value of the number
of animals remaining in the population is 100(1 − 0.2)
5
= 100(0.8)
5
= 32.768, that
is, about 33 animals. The total catch is then expected to be about (
z
1
+
z
2
+ . . . +
z
5
) = 67 animals. Generalizing these results, we can develop a model relating
the population size to the probability of capture and the total catch.
Assuming that assumptions a, b, and c hold, let
z
i
denote the catch in the
i
ith sample,
N
denote the true population size,
p
denote the expected propor-
tion of the available population captured in a sample, and
n
denote the num-
ber of samples taken. Then, the expected numbers in the successive catches
are
z
1
=
Np
,
z
2
=
N
(1 −
p
)
p
,
z
3
=
N
(1 −
p
)
2
p
, and in general
z
n
=
N
(1 −
p
)
n
-1
p
.
Another approximate relationship is obtained by noting that the expected
number remaining in the population after the
n
th removal is
N
(1 −
p
)
n
. This
plus the number removed adds to
N
, so that
N
≈ (Number removed) +
N
(1 −
p
)
n
,