Geoscience Reference
In-Depth Information
The effort in the northern stratum was 493.56 km, in the central stratum
it was 406.01 km, and in the southern stratum it was 1199.81 km, with a
total effort of 2099.38 km. The detection function and cluster size were
estimated for all strata, but the encounter rate was estimated separately
for each stratum. A cluster was considered when two or more individu-
als were sighted at a distance of less than a body length from each other.
The density, abundance, variance, and confidence intervals were esti-
mated in Distance (Thomas et al., 2009). The hazard rate, half-normal,
and uniform models with cosine, simple polynomial, and Hermite poly-
nomial series expansions were used, and the one with the lowest value
of Akaike's information criterion (AIC) was selected. It was assumed
that not all the sperm whales were detected at zero distance
g
(0), and the
sighting information by independent observers was used to estimate the
proportion of individuals not detected by the main observers.
The estimated value of
g
(0) was 0.81 with a standard error of 0.18. This
estimate improved previous sperm whale density estimates. Previously,
it was customary to underestimate it because a fraction of animals is
not usually available to the main observers because of the typical sperm
whale diving behavior (Barlow and Sexton, 1996). A total of 132 sperm
whales were observed in 89 sightings distributed only in the central and
southern strata. The mean cluster size was 1.4 sperm whales, and there
was a standard error of 0.07. Given the frequency of perpendicular dis-
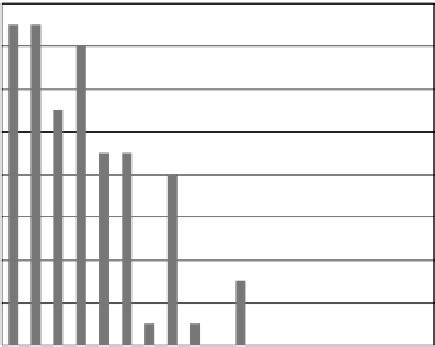
tances from sperm whale sightings, the distribution of these distances
was truncated at 5.5 km to discard all the observations beyond that
distance, as shown in Figure 4.6. The uniform model with cosine series
expansion was selected. The estimated value of
f
(0) was 0.344 km
−1
with
percentage coefficient of variation (% CV) = 4.46; the sperm whale density
and abundance estimates by strata are shown in Table 4.2.
16
1.3
n = 99
1.2
1.1
1.0
0.9
0.8
0.7
0.6
0.5
0.4
0.3
0.2
0.1
0.0
14
12
10
8
6
4
2
0
0.25
1.25
2.25
3.25
Perpendicular Distance (Km)
4.25
5.25
6.25
7.25
8.25
9.25
FIGURE 4.6
Histogram of perpendicular distances of sperm whale sightings in the Gulf of California, sam-
pled by line transect surveys. The fitted detection function is also shown (see text).