Geoscience Reference
In-Depth Information
60
60
1
122
114
3
1
122
114
3
7144
6339
14
7144
6339
14
103
150
6
103
150
6
10
10
2
2
2
2
3
3
12
12
2
2
2
2
4
4
5
20
5
20
3
3
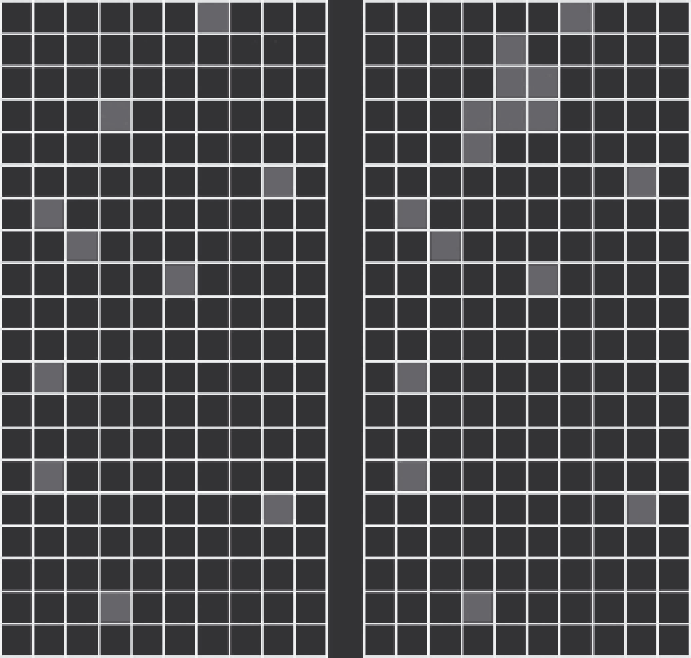
FIGURE 3.1
A population of blue-winged teal ducks. (From Smith, D.R., Conroy, M.J., and Brakhage,
D.H.
Biometrics
51: 777-788, 1995.) There are two hundred 25-km
2
quadrats with the counts of
observed ducks shown. The left side shows an initial sample of 10 quadrats, and the right side
shows the final sample. One network larger than one quadrat in size is selected in the final
sample (the network has seven quadrats in it). The condition to trigger adaptive selection was
y
i
≥ 1. A neighborhood was defined as the surrounding four quadrats.
will be in the initial sample. For the
k
th network of size
x
k
,
the initial intersec-
tion probability is
Nx
−
N
k
α= −
1
/
,
(3.2)
k
n
n
where
N
is the size of the study area,
x
k
is the size of the network, and
n
is
the size of the initial sample. The estimate of the variance of the estimated
population total involves the joint inclusion probabilities α
jk
and calculating
the probability that both network
j
and
k
appear in the initial sample where