Geoscience Reference
In-Depth Information
14
76
81
86
91
96
12
10
8
6
4
2
0
0
500
1000
1500
Distance (km)
2000
2500
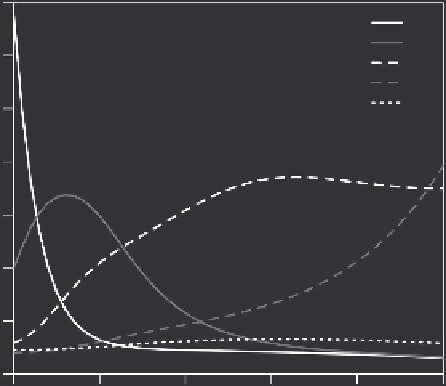
FIGURE 9.5
Estimated rate of change in house finch being present on a Breeding Bird Survey route as a
function of distance from Long Island. Peaks indicate the distance at which the fastest rates
of change occurred. Rate of change is indexed in terms of the beginning period; that is, “76”
relates to the rate of change between 1976 and 1981.
provided guidance on study design issues, including definition of a sam-
pling unit, what should be regarded as a season, and the required number
of repeat surveys per season. The main points are highlighted next, as well
as some updated thinking on these various issues. One main aspect of study
design for occupancy models, with subtleties that can initially be difficult for
some to fully grasp, is that no longer are we trying to sample individuals of
the target species (whether they be plants or animals); we are sampling land-
scapes (or seascapes, riverscapes, etc.). The occupancy category at a sampling
unit in the landscape is just a characteristic of that unit much like elevation,
latitude, or vegetation type. Finding individuals of the target species within
that unit is only one way to attempt to determine the occupancy category,
and the primary intent of the field methods should not, necessarily, be to
maximize the number of individuals captured.
9.6.1 Defining the Region of Interest
It is critically important to clearly define the region of interest to which the
results are intended to apply as this defines the statistical population from
which sampling units (however they are to be defined) are selected for sur-
veying. Expanding or contracting the area of interest might create issues
with the interpretation of results or lead to misleading conclusions about