Geoscience Reference
In-Depth Information
(a)
Santa Barbara
Santa Barbara cell
Pt.
Conception
N
Santa Monica
cell
0
50 km
San Miguel I.
Santa Cruz I.
Los Angeles
Santa Rosa I.
Santa
Monica
Basin
San Pedro cell
San
Pedro
Basin
Littoral cell
Oceanside
cell
Santa
Catalina I.
River
Sandy beaches
Rocky
coast
Catalina
Basin
Submarine Canyon
San
Diego
Trough
Submarine basin
San Clements I.
(b)
Los Angeles
Case Fig. 8.3
(a)
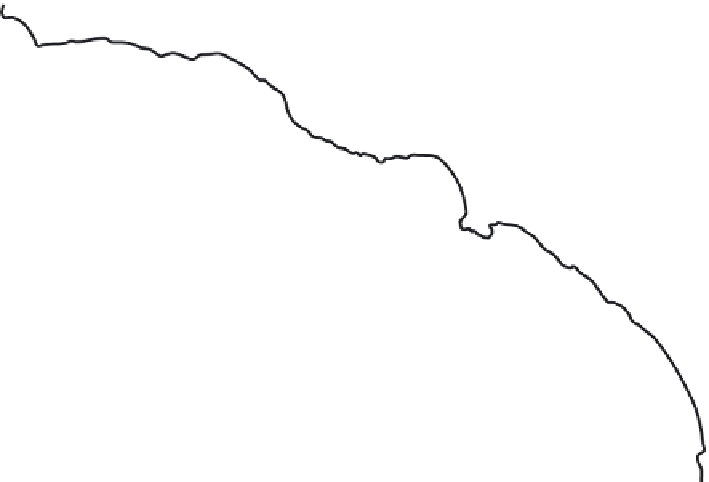
Sediment cells on the
southern California coast.
Each cell has identifiable
sediment sources, sinks
and transport pathways.
(Adapted from Flick
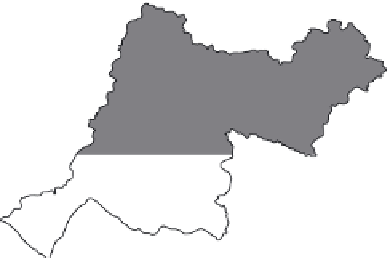
1993.) (b) River
catchments and dams in
the Los Angeles sector of
the San Pedro cell (see
(a)). The large number of
dams in the small, steep
coastal catchments has
significantly reduced
sediment supply to the
coast and contributed to
coastal erosion. (c) Littoral
sediment budget for
Californian beaches. If
sediment flux
Q
L
in (i)
(natural conditions)
diminishes to
q
L
in (ii)
(post-impoundment) and
littoral transport
Q
LT1
remains constant the
initial beach volume must
reduce to balance the
sediment budget. (After
Willis & Griggs 2003.)
Big Tujunga
Hansen
Sepulveda
San Gabriel
Devil's Gate
Santa Fe
Puddingstone
Prado
Riverside
Pacific
Ocean
N
0
10 km
(c)
(i)
(ii)
Land
q
L
Q
L
V
B
V
B
Beach
Q
LT2
Q
LT1
Q
LT1
Q
LT2
Ocean
Ocean
V
B
V
B
Q
LT1
Q
L
Q
LT2
q
L
Q
LT2
Q
LT1
=
+
−
=
+
−
t
t


