Geoscience Reference
In-Depth Information
The
Wash
Hut Marsh
Norwich
N
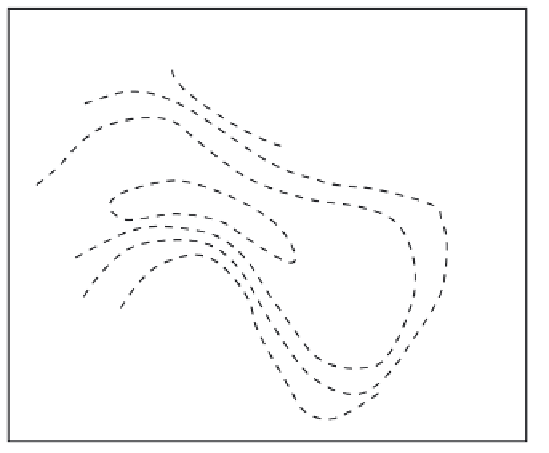
Fig. 7.6
Rates of sediment accretion (in mm yr
−
1
)
in relation to creek proximity. Data based on Hut
Marsh, North Norfolk (UK). (Based on data from
Stoddart et al. 1989.)
0
25
m
the loss of such energy is coupled by a reduced
ability to carry sediment, leading to increased
sediment deposition.
Attenuation of wave energy due to baffling
by vegetation will lead to the increased deposi-
tion of sediment directly onto the marsh surface.
However, this need not be uniform across
the marsh surface. Given that one of the prime
mechanisms that increases deposition is the loss
of wave energy, the areas of greatest deposition
will occur in the parts of the marsh that create
the greatest dampening effect to waves. Studies in
North Norfolk (UK) have shown that the rate of
sedimentation decreases with distance from both
the seaward edge and creeks. At Hut Marsh on
Scolt Head Island, North Norfolk, Stoddart et al.
(1989) showed that accretion rates near major
creeks reached 8 mm yr
−1
, falling to 2 mm yr
−1
away from the creeks (Fig. 7.6). This is because
as the water starts to flow onto the marsh
(whether from the seaward edge or having over-
flowed onto the marsh surface following entry
via a creek system), the greatest energy loss
will occur over a relatively short period of time
(see also Allen 2000). Other studies have also
quantified this change in sedimentation rate.
Richard (1978) has shown that for a marsh in
Long Island, New York, vertical accretion rates
are typically in the order of 9 to 37 mm yr
−1
along the seaward edge of the marsh, falling to
between 2 and 4 mm yr
−1
at the landward edge.
These figures, particularly for the low, pioneer
marsh, show a wide discrepancy, and this relates
back to the earlier point that the greatest rates
of sedimentation will occur in those parts of
the marsh that create the greatest energy loss.
Even though the seaward edge of the marsh may
be collectively referred to as low or pioneer
marsh, there will still be considerable variation
in vegetation height, density and exposure to
waves and thus the loss of energy and corres-
ponding increases in sedimentation rates will
vary spatially. Similar depositional patterns and
variation are shown for marshes along the
New Brunswick coast, Bay of Fundy (Chmura
et al. 2001), and along the Normandy coast of
France, where mean vertical accretion rates fall
from 5.5 to 4.1 mm yr
−1
with distance from the
marsh edge (Haslett et al. 2003).
In deltas, the pattern of sedimentation along
the seaward margins is controlled by the pro-
cesses acting as the river discharges into the
relatively still body of water (see Fig. 7.4 inset).
The classification of deltas by Bates (1953) men-
tioned in section 7.1.3 is useful in this context.
Where deltas form as rivers enter a freshwater
lake, water densities are the same (homopycnal).
Here, mud deposits are rare because there is no