Geoscience Reference
In-Depth Information
for example, 10,000 km from the Gobi Desert
to Alaska (Rahn et al. 1981). The major source
of this dust is from the semi-arid areas of the
world, particularly those desert environments
containing floodplains, alluvial fans, wadis, salt-
pans and former lake beds (Middleton 1997).
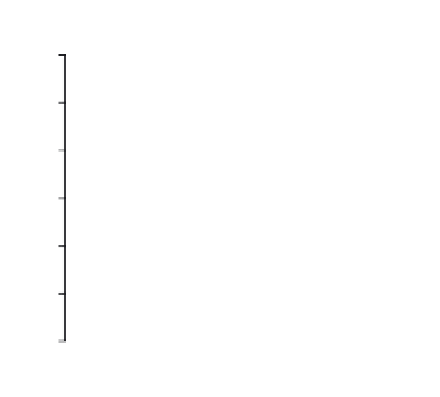
8 major floods
600
Reach A
Reach B
500
400
Recovery
5.2.4.1 Transport zones
300
200
The key zones where sediment transport by wind
dominates are in sand seas, sheets and stringers,
with highest rates in sheets and stringers. These
act as part of local and regional-scale aeolian
transport zones from source areas to sinks
(Lancaster 1995) and are found most commonly
in areas with mean rainfalls of
100
0
1880
1900
1920
Year
1940
1960
150 mm yr
−1
(Wilson 1973). In such environments vegetation
effects are limited. Transport rates in duneless
sand sheets and stringers have been quoted as high
as 62.5-162.5 m
3
per metre width per year in
Mauritania (Sarnthein & Walger 1974) whereas
mobile barchan dunes are reported at 3.49 m
3
per metre width per year (Thomas 1997b). These
zones of transport reflect local topography, and
may be sinuous and river-like in form (Zimbelman
et al. 1995). Typically net accumulation of sands
and bedforms (sand dunes and seas) will occur
only where accumulation exceeds net transport.
In cases where net transport exceeds accumula-
tion then sand sheets and stringers will dominate.
<
Fig. 5.8
Historical changes in channel width (1875-1970) for
the Gila River, Arizona. (Adapted from Burkham 1972.)
1993). Aeolian dust (suspended particles typ-
ically less than 50
m) is significant in global
transport of sediment and it has been demon-
strated that on a global scale the quantities of
dust in motion are of the same order of magni-
tude as the quantities of sediment carried by
rivers (Livingstone & Warren 1996). In areas of
net sediment deposition, rates of accumulation
of aeolian-derived sediment have been recorded
at up to 70 mm kyr
−1
(Dunkerley & Brown 1997)
and dust can be transported over large distances,
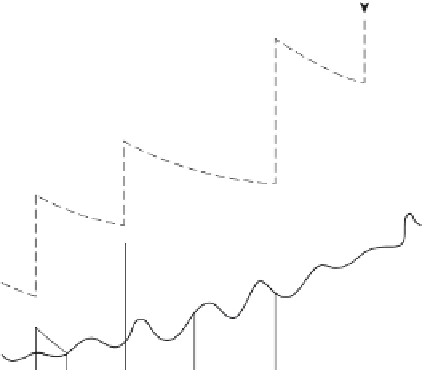
μ
Tributary
Tributary
High-
magnitude
event
Tributary
Low-
magnitude
event
Tributary
Fig. 5.9
Conceptual model of transmission
losses and their relation to flow in an ephemeral
channel for storms of two different magnitudes.
The shaded area represents discharge. Note the
intermittent channel flow for the low-magnitude
event, and continuous but variable discharge for
the high-magnitude event as a function of
tributary input and transmission losses.
(After Thornes 1977.)
Transmission
losses
Recharge
Recharge
Downstream