Geoscience Reference
In-Depth Information
100
100
(b)
Empirical data
Driving variable
50
50
Modelled values
January 1990
(a)
0
0
1
131
261
391
521
1
131
261
391
521
Weeks
Weeks
20
1
(d)
10
0.5
(c)
0
0
1
131
261
391
521
1
131
261
391
521
Weeks
Weeks
3
(e)
2
(f)
Modelled values
Modelled values
Empirical maximum data
1.5
1
Empirical minimum data
Empirical data
0
0
1
131
261
391
521
1
131
261
391
521
Weeks
Weeks
Alarm limit
10
(g)
Critical limit
5
0
1
131
261
391
521
Weeks
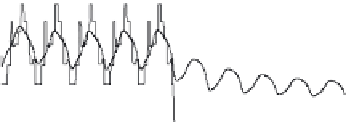
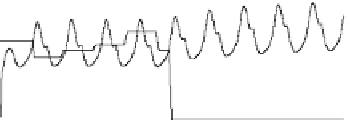
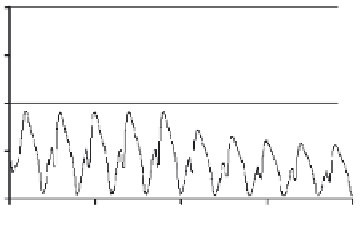
Case Fig. 4.3
Case-study on eutrophication/oligotrophication in Lake Miastro, Belarus. There was a drastic reduction in the
use of fertilizers in argriculture in 1990. This has influenced the river concentration of phosphorus, as shown in (a), the driving
variable in this scenario. It can then be asked how this will influence: lake concentrations of phosphorus (b), concentrations
of suspended particulate matter (SPM; (c)), sedimentation of matter (d), phosphorus concentrations in A-sediment (e) and
operational variables of ecosystem effect, such as the Secchi depth (f ) and the algal volume (g).


