Geoscience Reference
In-Depth Information
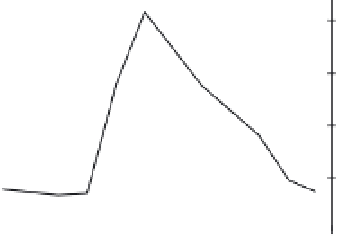
occurring in the upper reaches, sending a pulse of
water down the river, before ice on the lower
reaches has melted properly. This is not unique to
the Mackenzie river, all the great rivers draining
northwards in Europe, Asia and North America
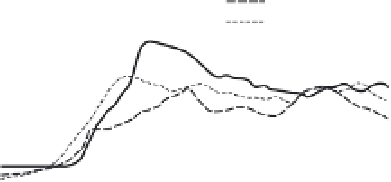
exhibit the same tendencies. If we look in detail
at an individual year (Figure 4.17) you can see the
difference in daily hydrographs for stations
moving down the river (i.e. northwards). Table
4.2 summarises the information on latitude
and flow characteristics for the Mackenzie. It is
not a simple story to decipher (as is often the
case in hydrology), but you can clearly see that the
rise in discharge at the Arctic Red River station
starts later than the Norman Wells station further
150.0
20,000
15,000
100.0
10,000
50.0
5,000
0.0
0
Jan
Feb Mar Apr May
Jun
Jul
Aug Sep Oct Nov Dec
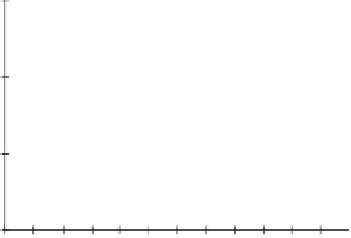
Figure 4.16
Average monthly river flow (1972-1998;
line) for the Mackenzie river at the Arctic Red River
gauging station (latitude 67° 27
'
30'' north) and
average precipitation (1950-1994) for the Mackenzie
river basin (bars).
Source
: Data courtesy of Environment Canada
20,000
Fort Simpson
Norman Wells
Arctic Red River
16,000
month later in July. Overall there is very little
variation in precipitation but a huge variation on
riverflow. This an excellent example of the storage
capability of snow and ice within a river catch-
ment. Any water falling during the winter months
is trapped in a solid form (snow or ice) and
may be released only during the warmer summer
months. The amount of precipitation falling
during the summer months (mostly rainfall) is
dwarfed by the amount of water released in the
melt during May and June.
The most remarkable feature of a river system
such as the Mackenzie is that the melt starts
12,000
8,000
4,000
0
Figure 4.17
Daily river flow at three locations on the
Mackenzie river from mid-April through to the end
of June 1995.
Source
: Data courtesy of Environment Canada
Table 4.2
Summary of latitude and hydrological characteristics for three gauging stations on the
Mackenzie river
Mackenzie river
Latitude (north)
Date of last ice
Date of peak
gauging station
on river (1995)
discharge (1995)
Fort Simpson
61° 52
′
7
″
14 May
21 May
Norman Wells
65° 16
′
26
″
18 May
10 May
Arctic Red River
67° 27
′
30
″
31 May
14 May
Source
: Data courtesy of Environment Canada