Geoscience Reference
In-Depth Information
500
Soil moisture
Max. VPD
Transpiration
4.5
1
400
3.5
0.8
300
2.5
0.6
0.4
200
1.5
0.2
100
0.5
0
0
-0.5
0
1
Soil moisture content
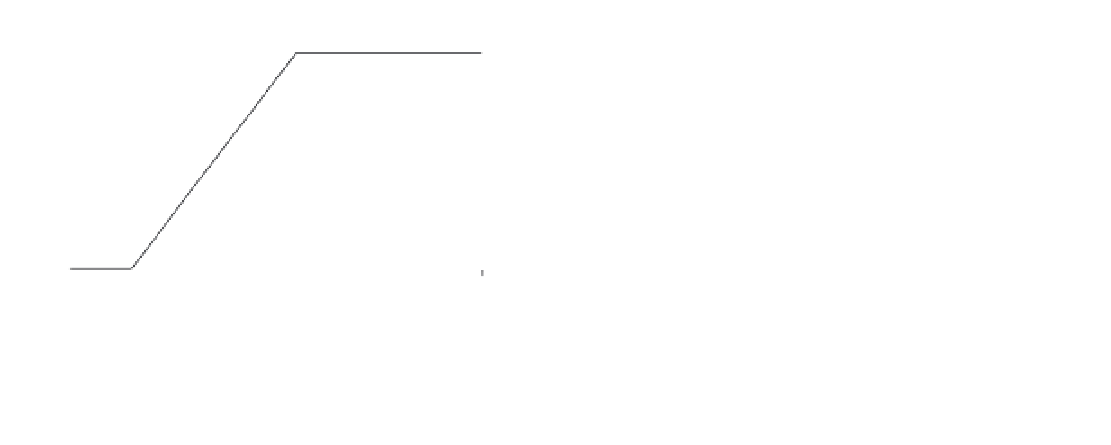
Figure 3.9
A hypothetical relationship between the
measured soil moisture content and the ratio of actual
evaporation to potential evaporation.
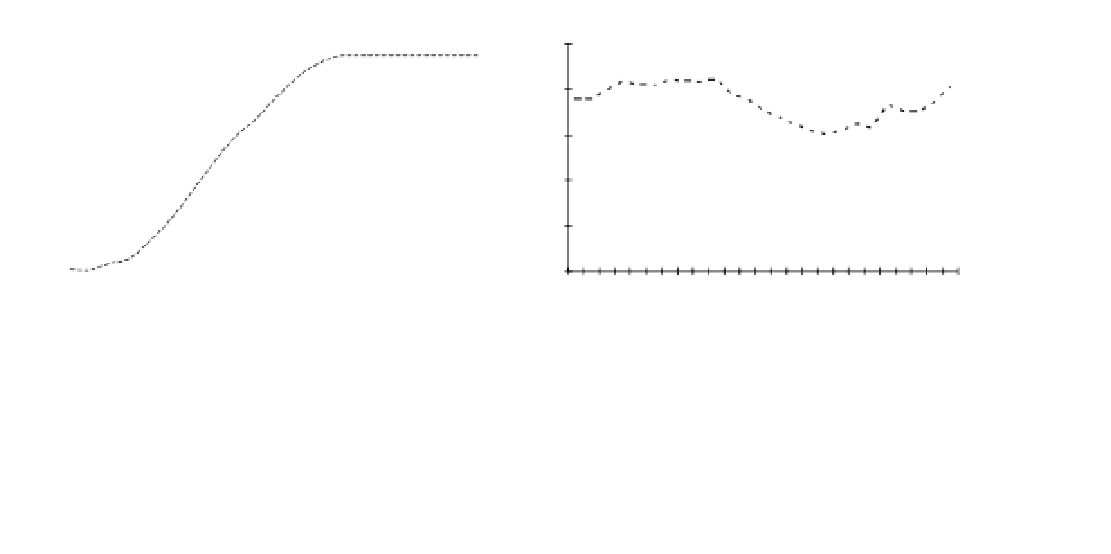
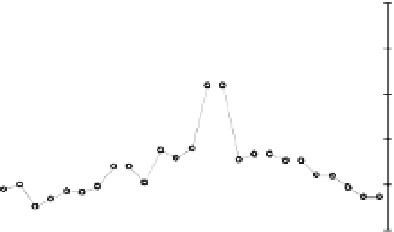
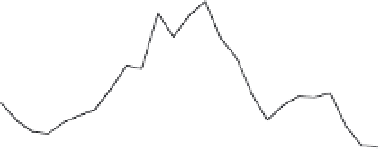
Figure 3.10
Time series of measured transpiration,
measured soil moisture and estimated vapour pressure
deficit for a forested site, near Nelson, New Zealand.
NB as a Southern Hemisphere site the summer is from
December until February.
Source
: Data courtesy of Rick Jackson
The relationship between actual evaporation and
soil moisture is not so simple where there is a
vegetation type that exerts stomatal control on the
evaporation rate (e.g. coniferous forest). In this case
the amount of evaporation will be related to both
soil moisture (available water) and the vapour
pressure deficit (ability of the atmosphere to absorb
water vapour). This is illustrated by Figure 3.10,
a time series of soil moisture, transpiration and
vapour pressure deficit for a stand of
Pinus radiata
in New Zealand. Transpiration was measured using
sapflow meters on a range of trees; soil moisture was
measured with a neutron probe and vapour pressure
deficit was estimated from a nearby meteorological
station. At the start of the summer period (Oct.-
Nov. 1998) the soil moisture level is high and the
transpiration rate climbs rapidly to a peak. Once
it has reached the peak, the transpiration rate
plateaus, despite the maximum vapour pressure
deficit continuing to climb. During this plateau in
transpiration rate the forest is exerting some
stomatal control so that the transpiration doesn't
increase by as much as the vapour pressure deficit.
From January 1999 (the height of the Southern
Hemisphere summer) the transpiration rate drops
markedly. Initially this matches a drop in the maxi-
mum vapour pressure deficit but the transpiration
rate continues to drop below early summer rates
(with similar VPD values). This is the time that the
lack of soil moisture is starting to limit the tree
transpiration. Figure 3.10 illustrates the complex
relationship between evaporation from a vegetated
surface, the soil moisture conditions and the
atmospheric conditions.
Remote sensing of evaporation
Water vapour is a greenhouse gas and therefore it
interferes with radiation (i.e. absorbs and reradiates)
from the earth's surface. Because of this the amount
of water vapour in the atmosphere can be estimated
using satellite remote sensing, particularly using
passive microwave sensors. The difficulty with
using this information for hydrology is that it is at
a very large scale (often continental) and is con-
cerned with the whole atmosphere not the near
surface. In order to utilise satellites for estimation
of evaporation a combined modelling and remote
sensing approach is required. Burke
et al
. (1997)
describe a combined Soil-Vegetation-Atmosphere-
Transfer (SVAT) model that is driven by remotely
sensed data. This type of approach can be used to
estimate evaporation rates over a large spatial area
relatively easily. Mauser and Schädlich (1998)
provide a review of evaporation modelling at
different scales using remotely sensed data.