Geoscience Reference
In-Depth Information
Case study
RAINFALL DISTRIBUTION IN A SMALL STUDY CATCHMENT
It is well known that large variations in rainfall
occur over quite a small spatial scale. Despite this,
there are not many studies that have looked at this
problem in detail. One study that has investigated
spatial variability in rainfall was carried out in the
Plynlimon research catchments in mid-Wales
(Clarke
et al
., 1973). In setting up a hydrological
monitoring network in the Wye and Severn
catchments thirty-eight rain gauges were installed
to try and characterise the rainfall variation. The
rainfall network had eighteen rain gauges in the
Severn catchment (total area 8.7 km
2
) and twenty
gauges in the Wye (10.55 km
2
).
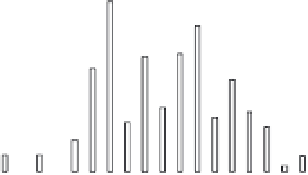
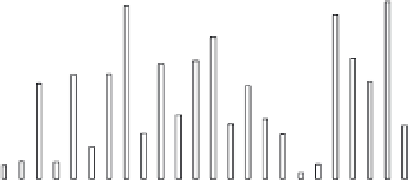
The monthly data for a period between April
1971 and March 1973 were analysed to calculate
areal average rainfall using contrasting methods.
The results from this can be seen in Figure 2.14.
The most startling feature of Figure 2.14 is the
lack of difference in calculated values and that they
follow no regular pattern. At times the arithmetic
mean is greater than the others while in other
months it is less. When the total rainfall for the
two-year period is looked at, the Thiessen's
calculation is 0.3 per cent less than the arithmetic
mean, while the isohyetal method is 0.4 per cent
less.
When the data were analysed to see how many
rain gauges would be required to characterise the
rainfall distribution fully it was found that the
number varied with the time period of rainfall and
the season being measured. When monthly data
were looked at there was more variability in winter
rainfall than summer. For both winter and
summer it showed that anything less than five rain
gauges (for the Wye) increased the variance
markedly.
A more detailed statistical analysis of hourly
mean rainfall showed a far greater number of
gauges were required. Four gauges would give an
accuracy in areal estimate of around 50 per cent,
while a 90 per cent accuracy would require 100
gauges (Clarke
et al
., 1973: 62).
The conclusions that can be drawn from the
study of Clarke
et al
. (1973) are of great concern
to hydrology. It would appear that even for a small
catchment a large number of rain gauges are
required to try and estimate rainfall values
properly. This confirms the statement made at the
start of this chapter: although rainfall is relatively
straightforward to measure it is notoriously
difficult to measure accurately and, to compound
the problem, is also extremely variable within a
catchment area.
350
Arithmetic
Thiessen
Isohyetal
300
250
200
150
100
50
Apr-71
Aug-71
Dec-71
Apr-72
Aug-72
Dec-72
Figure 2.14
Areal mean rainfall (monthly) for the
Wye catchment, calculated using three different
methods.
Source
: Data from Clarke
et al
. (1973)
introduces an extremely important concept in
hydrology: the
frequency-magnitude
relation-
ship. With rainfall (and runoff - see Chapters 5
and 6) the larger the rainfall event the less frequent
we would expect it to be. This is not a linear
relationship; as illustrated in Figure 2.15 the curve
declines in a non-linear fashion. If we think of the
relative frequency as a probability then we can say