Geoscience Reference
In-Depth Information
Each polygon is drawn on a map; the boundaries
of the polygons are equidistant from each gauge and
drawn at a right angle (orthogonal) to an imaginary
line between two gauges (see Figure 2.12). Once the
polygons have been drawn the area of each polygon
surrounding a rain gauge is found. The spatially
averaged rainfall (
R
) is calculated using formula
2.1:
m
=
=
∑
1
(2.2)
Rr
jj
j
where
r
j
is the average rainfall between two contour
intervals and
p
j
is the proportion of the total
catchment area between those contours (derived
from the hypsometric curve). The
r
j
value may be an
average of several rain gauges where there is more
than one at a certain contour interval. This is
illustrated in Figure 2.13 where the shaded area (
a
3
)
has two gauges within it. In this case the
r
j
n
=
=
∑
1
ra
A
(2.1)
ii
R
i
value
will be an average of
r
4
and
r
5
.
where
r
i
is the rainfall at gauge
i
,
a
i
is the area of the
polygon surrounding rain gauge
i
, and
A
is the total
catchment area.
The
areal rainfall
value using Thiessen's poly-
gons is a weighted mean, with the weighting being
based upon the size of each representative area
(polygon). This technique is only truly valid where
the topography is uniform within each polygon so
that it can be safely assumed that the rainfall
distribution is uniform within the polygon. This
would suggest that it can only work where the rain
gauges are located initially with this technique in
mind (i.e.
a priori
).
a
1
r
1
a
2
r
2
r
3
a
3
r
4
r
5
Hypsometric method
r
6
a
4
Since it is well known that rainfall is positively
influenced by altitude (i.e. the higher the altitude
the greater the rainfall) it is reasonable to assume
that knowledge of the catchment elevation can be
brought to bear on the spatially distributed rainfall
estimation problem. The simplest indicator of the
catchment elevation is the hypsometric (or
hypsographic) curve. This is a graph showing the
proportion of a catchment above or below a certain
elevation. The values for the curve can be derived
from maps using a planimeter or using a digital
elevation model (DEM) in a GIS.
The hypsometric method of calculating spatially
distributed rainfall then calculates a weighted
average based on the proportion of the catchment
between two elevations and the measured rainfall
between those elevations (equation 2.2).
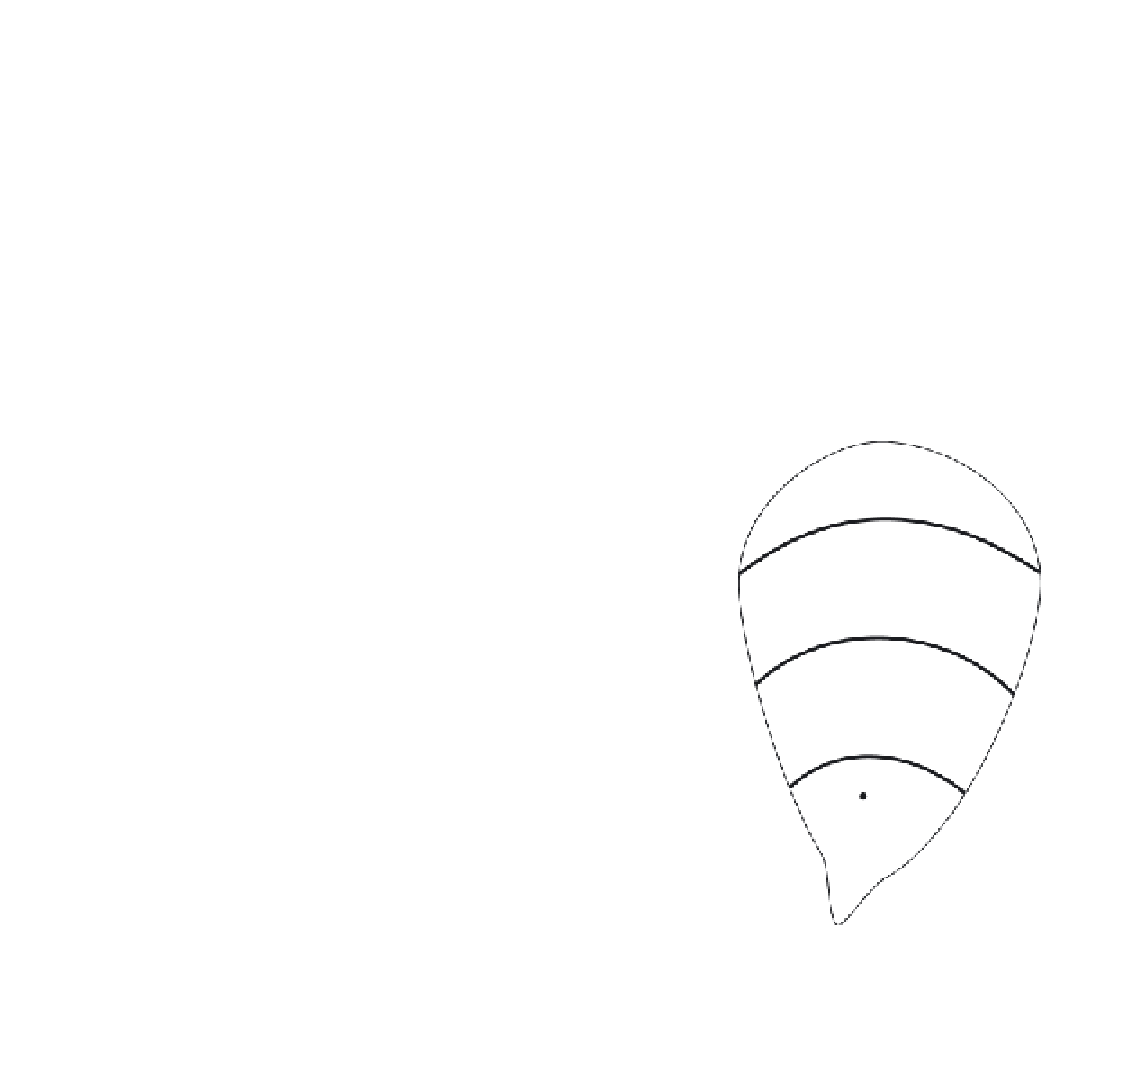
Figure 2.13
Calculation of areal rainfall using the
hypsometric method. The shaded region is between two
contours. In this case the rainfall is an average between
the two gauges within the shaded area. Locations of
rain gauges are indicated by bullet points.
Intuitively this is producing representative areas
for one or more gauges based on contours and spac-
ing, rather than just on the latter as for Thiessen's
polygons. There is an inherent assumption that
elevation is the only topographic parameter affect-
ing rainfall distribution (i.e. slope and aspect are
ignored). It also assumes that the relationship