Geoscience Reference
In-Depth Information
also illustrates the point, with the number of
rain days at different sites in a cross section across
the South Island. Although not shown on the
transect in Figure 2.2 recordings of rainfall further
north in the Southern Alps (Cropp River inland
from Hokitika) are as high as 6 m a year.
This pattern of rain shadow is seen at many
different locations around the globe. It does not
require as large a barrier as the Southern Alps
- anywhere with a significant topographical
barrier is likely to cause some form of rain shadow.
Hayward and Clarke (1996) present data show-
ing a strong rain shadow across the Freetown
Peninsula in Sierra Leone. They analysed mean
monthly rainfall in 31 gauges within a 20
50 km area, and found that the rain shadow effect
was most marked during the monsoon months
of June to October. The gauges in locations facing
the ocean (south-west aspect) caught consider-
ably more rainfall during the monsoon than those
whose aspect was towards the north-east and
behind a small range of hills.
0
100 km
Westport
Tasman Sea
Hokitika
Hanmer
Christchurch
F
ranz Josef
Mt Cook
Tekapo
Haast
Fairlie
Timaru
Milford
Canterbury
Bight
Alexandra
South Pacific
Ocean
5,000
4,000
3,000
2,000
1,000
0
Mt Cook
village
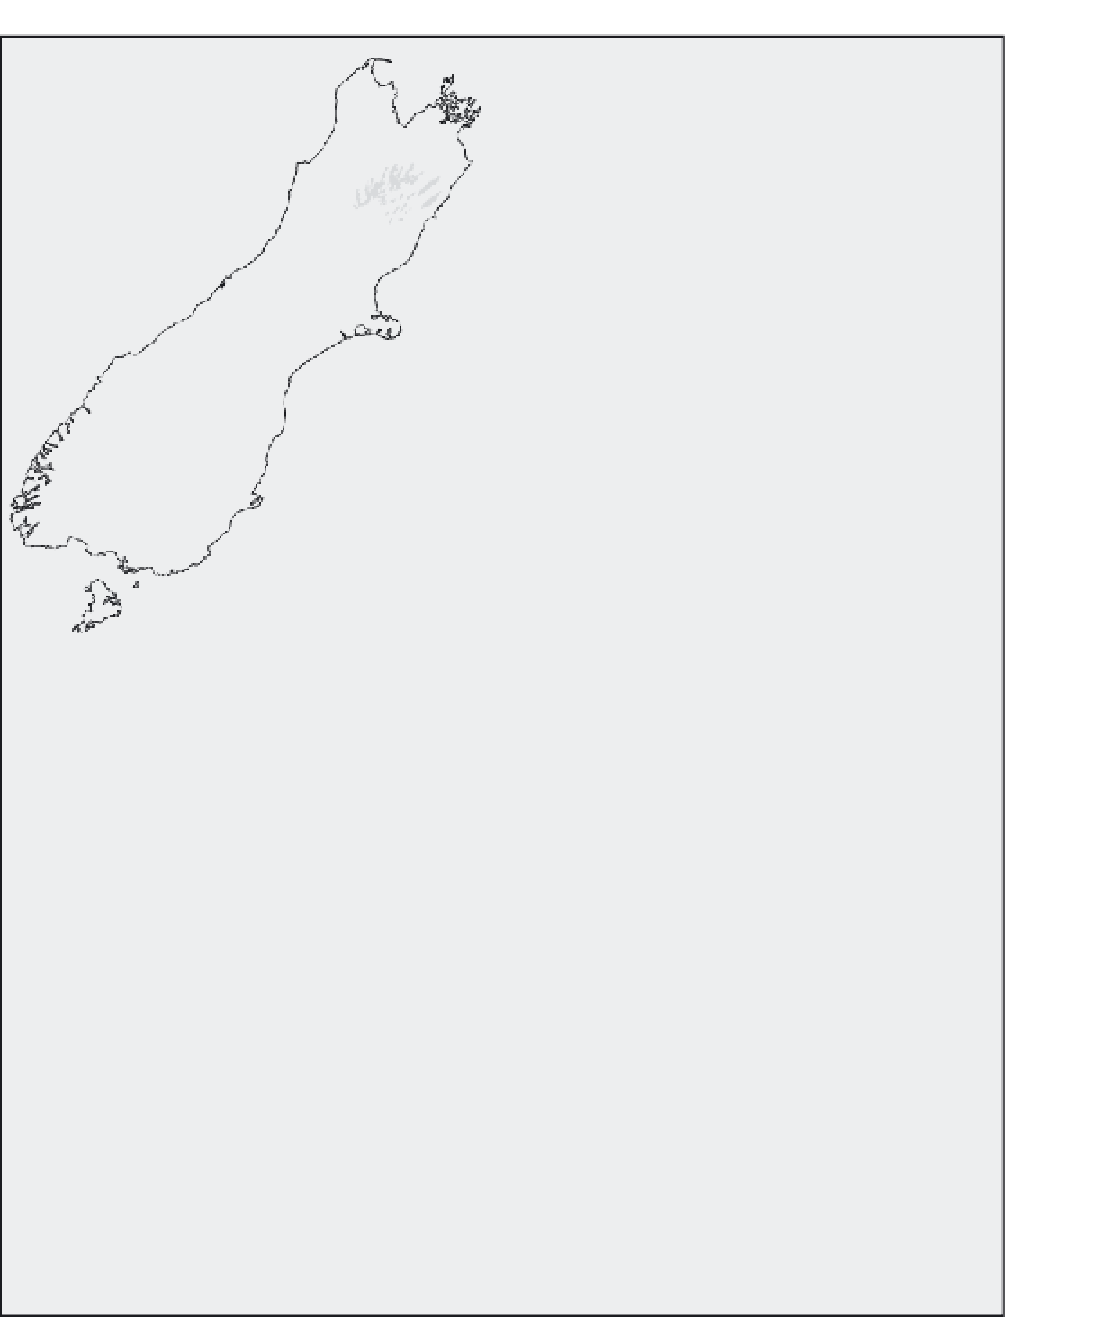
Figure 2.2
Rainfall distribution across the Southern
Alps of New Zealand (South Island). Shaded areas on
the map are greater than 1,500 m in elevation. A clear
rain shadow effect can be seen between the much
wetter west coast and the drier east.
Haast
Franz Josef
Tekapo
Fairlie
Timaru
Table 2.2
Average annual rainfall and rain days for a cross section across the South Island
Weather station
Height above mean sea level
Annual rainfall (mm)
Rain days
Haast
30
5,840
175
Mt Cook village
770
670
120
Tekapo
762
604
77
Timaru
25
541
75
Note
: More details on weather differentials across the South Island of New Zealand are in Sinclair
et al
.
(1996)
Source
: Data from New Zealand Met. Service and other miscellaneous sources