Geoscience Reference
In-Depth Information
figures for the period 1980-1996 are shown in
Figure 8.11. This shows an overall decline in water
tables of around 0.8m but that some regions have
shown a rise (e.g. Nebraska 0.7m rise). Although
the overall water table has declined there has been
a slowing in the rate of decline. This has been
attributed to various factors including: a wetter
than usual period from 1980 to 1997; more effi-
cient irrigation usage and technology; regulation
of groundwater withdrawals and changing
commodity prices in agriculture.
It is encouraging that a decline in the rate of
water table drops has occurred in the Ogallala
aquifer, but these still represent an unsustainable
depletion of the groundwater. It is difficult to see
how the decline could be halted without a
complete change in agricultural production for the
region, but this is unlikely to occur until the price
of extracting the water is too high to be
economically viable. At the moment the region is
using an unsustainable management practice that
has led to substantial groundwater depletion and
is likely to continue into the near future.
6
5
4
3
Million
hectares
irrigated
land
2
1
0
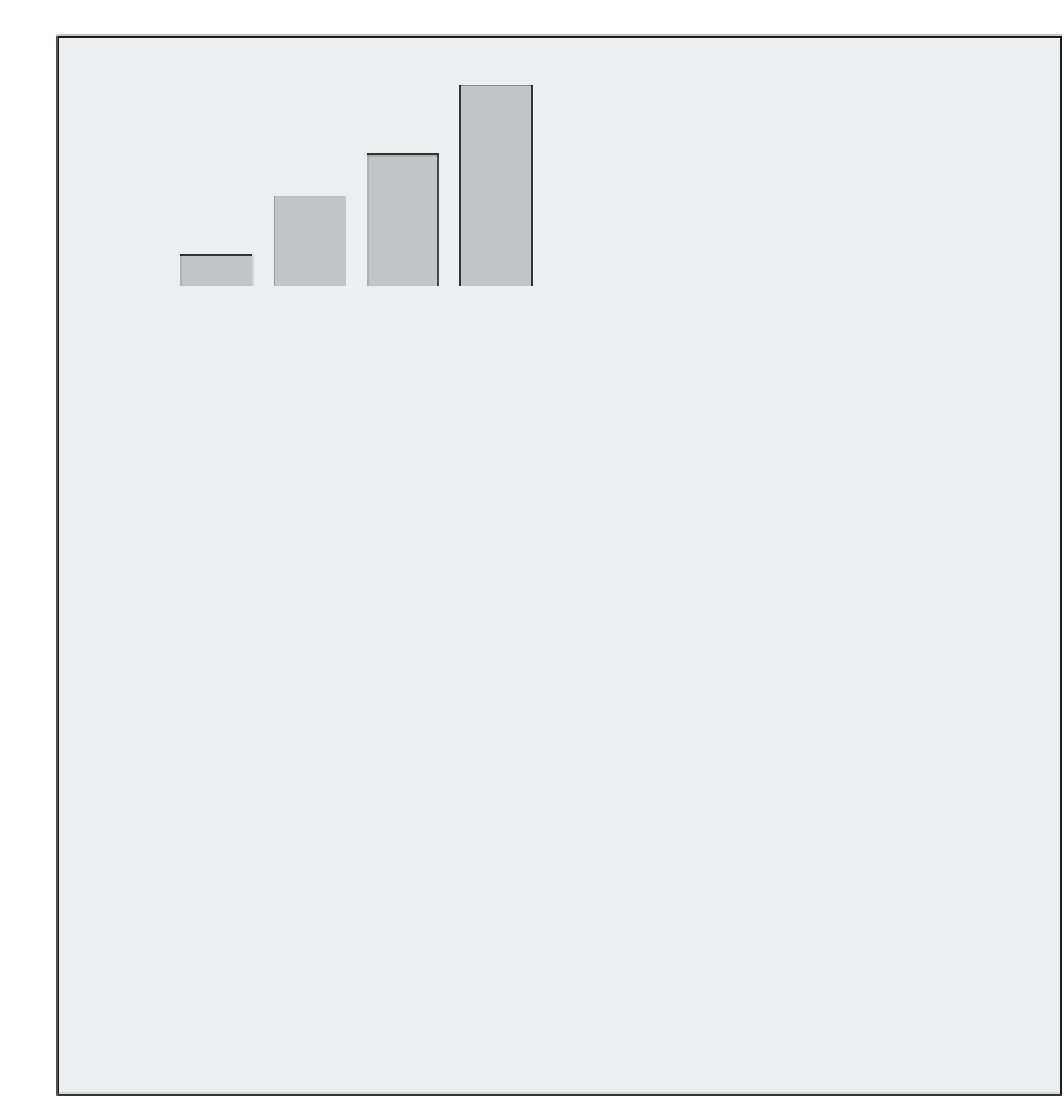
1949
1959
1969
1980
Figure 8.10
Amount of irrigated land using
groundwater in the High Plains region.
Source
: Data from McGuire and Fischer (1999)
has been drastic declines in water tables, as much
as 30 m in parts of Texas, New Mexico and Kansas
(McGuire and Fischer, 1999).
There have been various efforts made to try and
reduce the depletion of the Ogallala aquifer but it
is made difficult by the importance this area has
for agricultural production in the USA. Systems
of irrigation scheduling have been introduced to
make the use of irrigated water more efficient.
This involves a close monitoring of soil moisture
content so that water is only applied when needed
by plants and the actual amount required can be
calculated. Another management tool to lessen
depletion is changing agricultural production
so that water thirsty plants such as cotton are
not grown in areas that rely on groundwater for
irrigation.
The United States Geological Survey (USGS)
have been monitoring changes in water in over
7,000 wells since the late 1980s in order to assess
the rate of overall groundwater depletion. Average
2
1
0
-1
-2
-3
Figure 8.11
Average changes in the water table for
states underlying the Ogallala aquifer.
issue to consider under the title of change. There is
no question that urban expansion has a significant
effect on the hydrology of any river draining the
area. Initially this may be due to climate altera-
tions affecting parts of the hydrological cycle. The
most obvious hydrological impact is on the runoff
Urbanisation
Many aspects of urban hydrology have already been
covered, especially with respect to water quality (see
Chapter 7), but the continuing rise in urban
population around the world makes it an important