Geoscience Reference
In-Depth Information
increase in the amount of streamflow as a per-
centage of rainfall received. This reinforces the
idea of Wood (1924) that the native vegetation
uses more water than the introduced pasture
species.
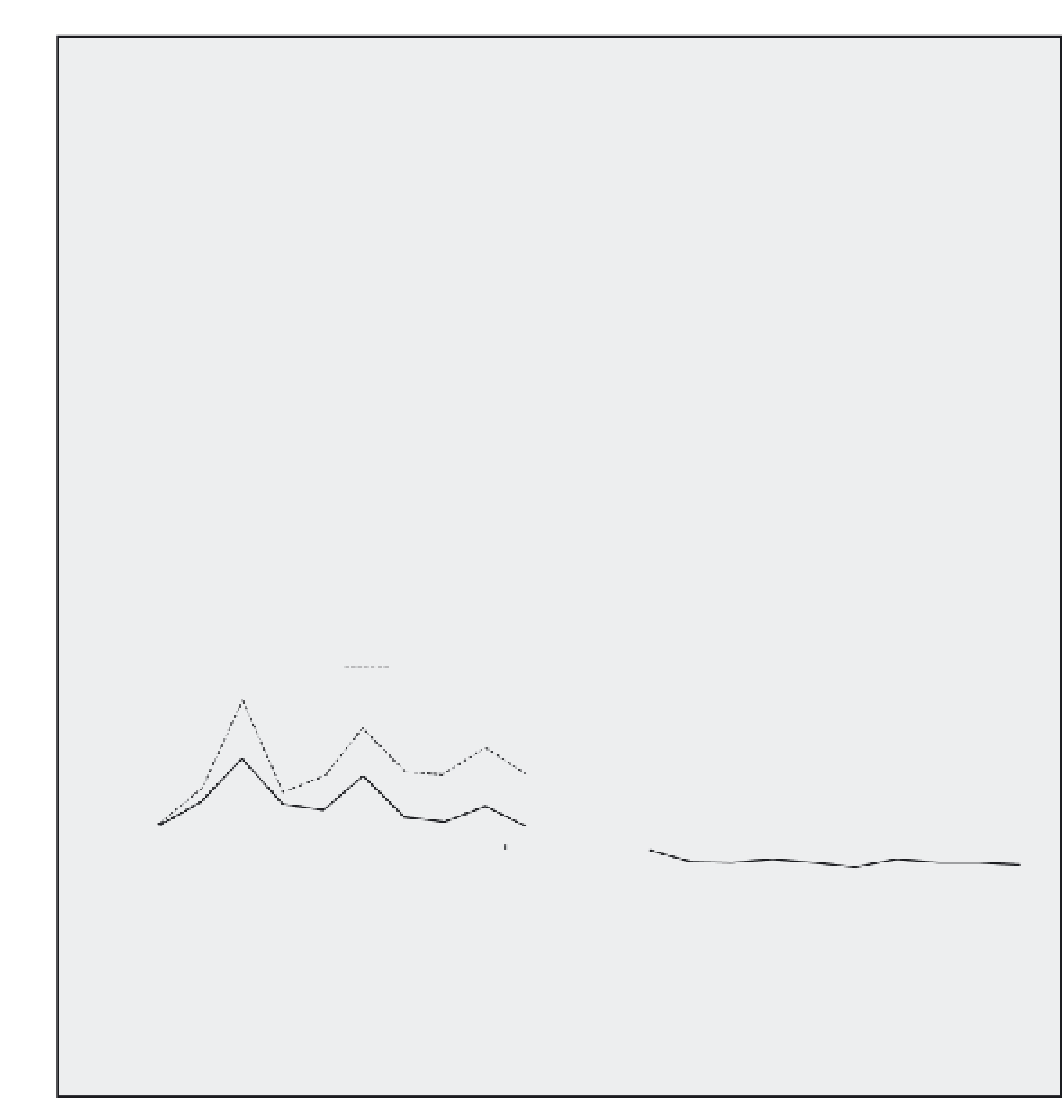
In terms of salinity there was also a marked
change although this is not immediately evident
from a time series plot (Figure 8.7). The chloride
concentration in streamflow is a good indicator
of salinity as it is one of the main salts that would
be expected to be deposited from sea spray, how-
ever it is not the total salinity. In Figure 8.7 there
appears to be an increasing difference between
chloride concentrations with time. Chloride con-
centration shows considerable variation between
years which is related to variation in rainfall
between years. The peaks in salinity correspond to
years with high rainfall. To remove this factor
Williamson
et al
. (1987) calculated the chloride
concentration as a ratio between output (measured
in the streamflow) and input (measured in the
rainfall). This is shown in Figure 8.8.
When the chloride level is expressed as this
output/input ratio (Figure 8.8) it is easy to see a
marked difference following the vegetation
change. In the years following 1976/77 there is
considerably more output of chloride than input
(i.e. the ratio is well above a value of 1), a result of
the chloride being leached out of the soil. In this
manner the chloride concentration in the river is
staying at a high level even when there is a low
input (i.e. low rainfall). Prior to vegetation change
the ratio is approximately even, the chloride
inputs and output had reached some type of
equilibrium. Given enough time the same would
happen again with the new vegetation cover, but
first a large store of chloride would be released
from the soil. This is a case where the vegetation
change has upset the hydrological balance of a
catchment, which in turn has implications for
water quality.
Cleared catchment
Control catchment
500
16
14
12
10
8
Cleared catchment
Control catchment
400
300
200
6
4
2
100
0
1974 1975 1976 1977 1978 1979 1980 1981 1982 1983
0
1974 1975 1976 1977 1978 1979 1980 1981 1982 1983
Figure 8.7
Chloride concentrations for two
catchments in south-west Western Australia. These
are the same two catchments as in
Figure
8.6.
NB World Health Organisation guidelines suggest
that drinking water should have chloride
concentration of less than 250mg/l.
Source
: Data from Williamson
et al
. (1987)
Figure 8.8
Chloride output/input ratio for two
catchments in south-west Western Australia. These
are the same two catchments as in Figures 8.6 and
8.7. Input has been measured through chloride
concentrations in rainfall while output is streamflow.
Source
: Data from Williamson
et al
. (1987)
water under a normal irrigation level would add
between 2 and 5 tons of salt per hectare per year.
The vast majority of this salt is washed out of the
soil and continues into a water table or river system;
some, though, will be retained to increase salination
in the soil.
Groundwater depeletion
In many parts of the world there is heavy reliance
on aquifers for provision of water to a population.
In England around 30 per cent of reticulated water
comes from groundwater, but that rises to closer to