Geoscience Reference
In-Depth Information
period, when the control was either local council
or RWAs, there was very little change when
assessed on a four-point scale. After 1980 the scale
was changed to five points and during this period
of predominantly RWA control the A grade water
quality declined while the percentage of 'fair'
water quality river reaches increased. In 1995 the
scale was changed again to make it five points
and also a differentiation was made between bio-
logical and chemical monitoring of water quality
(only the chemical results are shown in Figure
8.2). The measurements for 1990 have been
recalculated onto the 5-point scale to provide some
continuity between assessments. Since 1990 there
has been a rise in the two highest categories of
water quality at the expense of all the others,
a response to the extra investment in wastewater
treatment provided by the privatised water com-
panies. The percentage figures for 2000 suggest
that the lowest category of water quality has
been almost eliminated, although when this is
recalculated as river length it shows that there are
approximately 162 km of extremely poor quality
river reaches (out of a total 40,588 km assessed).
The 2005 figures show very little change from
2000.
In summary it has to be said that the biggest
impact on the water environment for England and
Wales has been the privatisation of supply and
wastewater treatment, and the setting up of a
separate environmental watchdog organisation, in
1989. Prior to this the water quality remained
static or worsened and the amount of water
abstracted continued to rise. Although the inte-
gration of water management into a holistic
structure based around the water catchments (i.e.
the RWAs) was a noble idea it made very little
difference to the crude measures shown here.
Since privatisation the water quality has improved
and the total amount of water abstracted has
decreased. Fundamentally the reason for this is
that the investment in infrastructure has risen
dramatically since privatisation. It is probably
reasonable to surmise that given the same increase
A
80
1958
1970
1975
1980
60
40
20
0
Unpolluted
Doubtful
Poor
Grossly
polluted
B
40
1980
1985
1990
30
20
10
0
Good (A)
Good (B)
Fair
Poor
Bad
C
40
1990
1995
2000
30
20
10
0
A
B
C
D
E
F
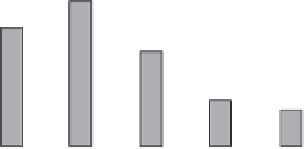
Figure 8.2
Water quality assessment for three
periods between 1985 and 2000. Explanation of
differing scales is given in the text.
in investment a RWA structure would have seen
a similar improvement. It was never likely, in
the political climate of the late 1980s, that this
investment would have come from the public
purse. It has been left to private companies, and
more particularly their customers, to pick up the
cost of that investment. The example of chang-
ing water management structure in England
and Wales shows us that this type of change can
have significant impacts on the overall hydrology
of a region.


