Geoscience Reference
In-Depth Information
obvious by the end of the 1980s that a raft of
upcoming European Community legislation on
water quality would require a huge investment in
waste treatment to meet water quality standards.
The government at the time decided that this
investment was best supplied through the private
sector and in 1989 a new Water Act was intro-
duced to privatise the supply of drinking water
and wastewater treatment. This has created a
set of private water companies with geographic
boundaries essentially the same as the RWAs. At
the same time a new body, the National Rivers
Authority (NRA), was set up to act as a watchdog
for water quality. This management structure
was still in place in 2002 except that since 1996
the NRA had been subsumed within a larger
body, the Environment Agency. The Environment
Agency (amongst other duties) monitors river
water quality, prosecutes polluters, and issues
licenses for water abstraction and treated waste
disposal.
This second factor has been forced upon the water
companies by political pressure, particularly
following a drought in 1995 and allegations of
water supply mismanagement in Yorkshire Water
plc. The reduction in leakage has required con-
siderable investment of capital into water supply
infrastructure. Overall the water abstracted for
public supply is now at the same level as the late
1970s, despite a population rise of nearly 4 million
in the corresponding period. The decline has also
been achieved despite an increase in the amount
of water consumed per household. The United
Kingdom has the highest water consumption per
capita in Europe and this is rising, a reflection of
changing washing habits and an increase in use
of dishwashers. This decline in water abstractions
is good for the aquatic environment as it allows a
more natural river regime and groundwater
system to operate with less human intervention.
It is more difficult to ascertain how the chang-
ing management structure has affected water
quality in England and Wales because the ways of
describing water quality have changed with time.
Figure 8.2 shows river water quality assessment
using three different scales. The figures shown are
achieved by sampling water quality over a period
of time (normally years) for hundreds of river
reaches around the country. During the first
How has this change affected water
resource management?
The answer to this question can be answered by
looking at figures for water abstraction and
measured water quality over time.
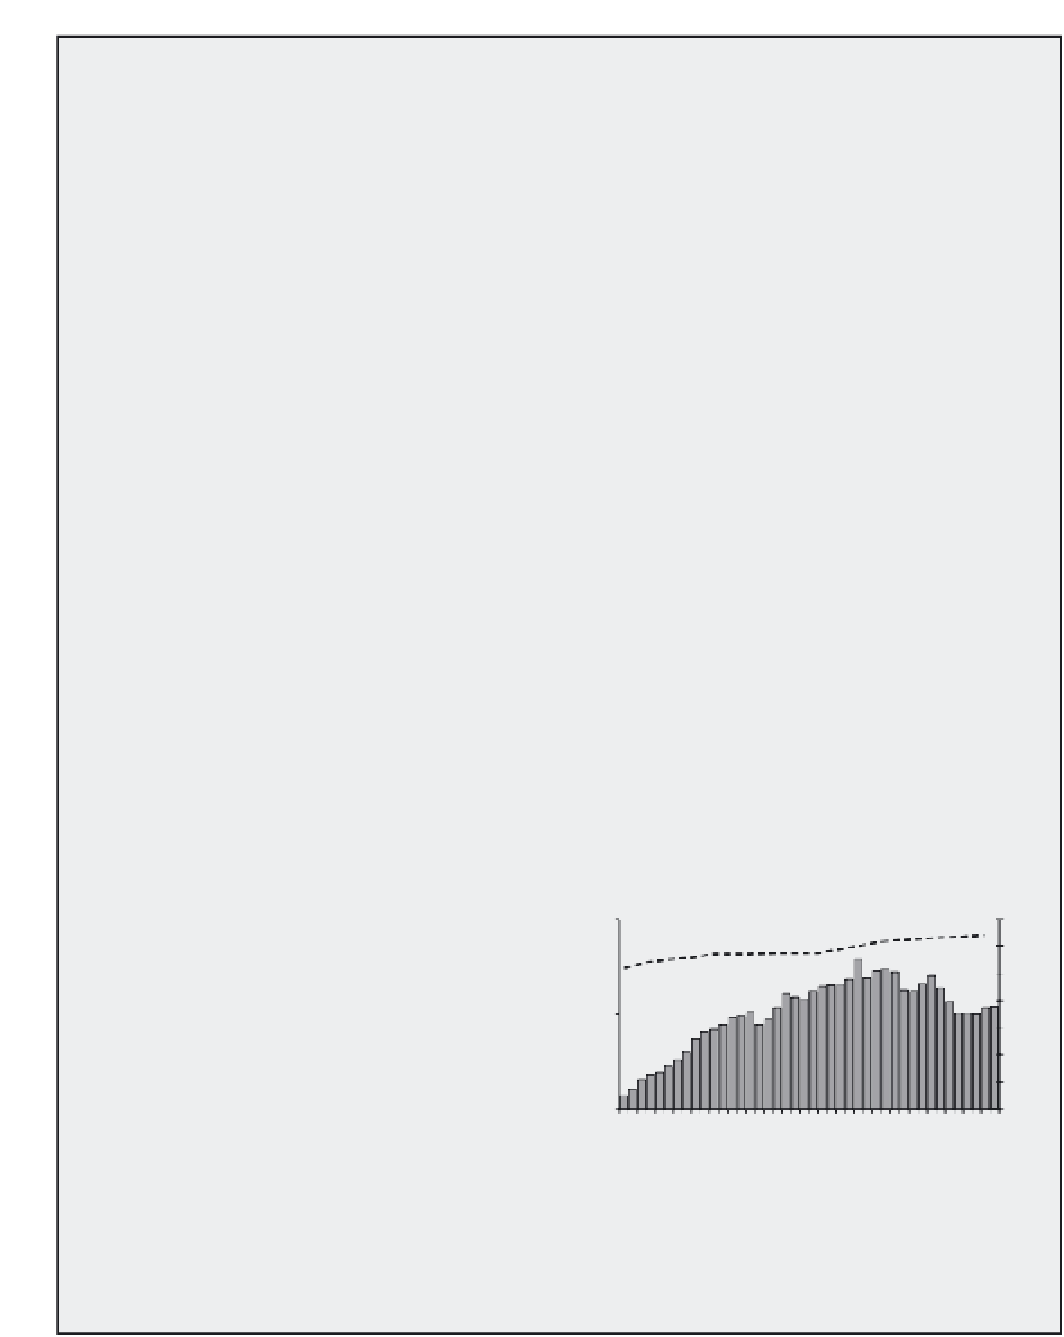
Figure 8.1 shows the water abstracted for
supply in England and Wales from 1961 to 2000.
During the period of public control (whether
councils or RWAs) there was a steady increase in
the amount of water abstracted, apart from a blip
in the mid-1970s when there were two particu-
larly dry years. Since privatisation in 1989 there
has been a flattening and then decline in the
amount of water abstracted. This decline cannot
be accounted for by the population which has
shown a gradual increase during the same time
period (see Figure 8.1). There are two causes of this
decline: less water being used for industry due to
a decline in the industrial sector (although this has
been in decline since the early 1980s), and a drop
in the amount of leakage from the supply network.
20
55
50
45
40
15
35
30
25
10
20
Figure 8.1
Abstracted water for England and Wales
1961-2003 (bar chart) with population for England
and Wales 1971-2001 shown as a broken line.
Source
: Data from OFWAT and various other sources