Geoscience Reference
In-Depth Information
analysis of when low flows occur needs to be carried
out so that the hydrological year avoids splitting in
the middle of a low flow period. In this case
P
(
X
)
refers to the probability of an annual minimum
greater than or equal to the value
X
. The formulae
used are the same as for flood frequency analysis
(Weibull etc.).
There is one major difference between flood
frequency and low flow frequency analysis which has
huge implications for the statistical methods used:
there is a finite limit on how low a flow can be. In
theory a flood can be of infinite size, whereas it is
not possible for a low flow to be less than zero
(negative flows should not exist in fresh water
hydrology). This places a limit on the shape of a
probability distribution, effectively truncating it on
the left-hand side (see Figure 6.15).
The statistical techniques described on pp.
111-112 (for flood frequency analysis) assume a
full log-normal distribution and cannot be easily
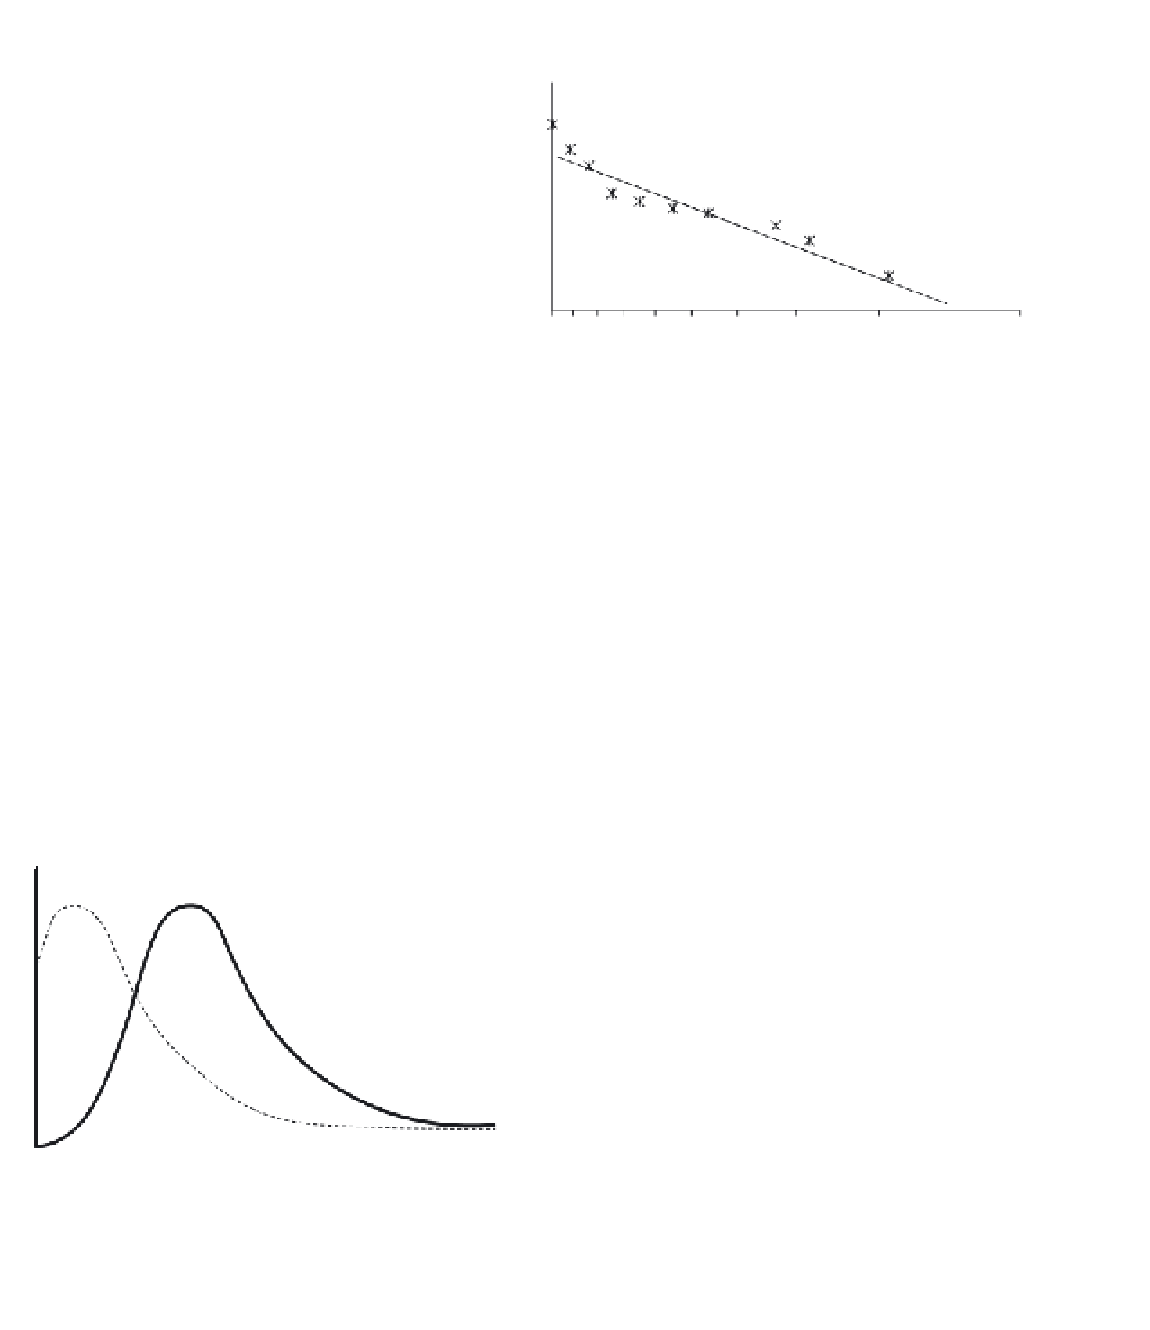
applied for low flows. Another way of looking at
this problem is shown in Figure 6.16 where the
probabilities calculated from the Weibull formula
are plotted against the annual minimum flow
values. The data fit a straight line, but if we extrapo-
late the line further it would intersect the x-axis at
a value of approximately 0.95. The implication from
this is that there is a 5 per cent chance of having
Annual minimum flow
0.1
1
Probability
Figure 6.16
Probability values (calculated from the
Weibull sorting formula) plotted on a log scale
against values of annual minimum flow (hypothetical
values).
a flow less than zero (i.e. a negative flow). The way
around this is to fit an exponential rather than
a straight line to the data. This is easy to do by eye
but complicated mathematically. It is beyond the
level of this text to describe the technique here
(see Shaw, 1994, or Wang and Singh, 1995 for more
detail). Gordon
et al
. (1992) provide a simple
method of overcoming this problem, without using
complicated line-fitting procedures.
Limitations of frequency analysis
As with any estimation technique there are several
limitations in the application of frequency analysis;
three of these are major:
n
1
The estimation technique is only as good as the
streamflow records that it is derived from. Where
the records are short or of dubious quality very
little of worth can be achieved through frequency
analysis. As a general rule of thumb you should
not extrapolate average recurrence intervals
beyond twice the length of your data set. There
is a particular problem with flood frequency
analysis in that the very large floods can create
problems for flow gauges and therefore this
extreme data may be of dubious quality (see
pp.89).
Q
Figure 6.15
Two probability density functions. The
usual log-normal distribution (solid line) is contrasted
with the truncated log-normal distribution (broken
line) that is possible with low flows (where the
minimum flow can equal zero).