Geoscience Reference
In-Depth Information
assumption made in flood frequency analysis that
the peak flows are independent of each other (i.e.
they are not part of the same storm). If a calendar
year is chosen for a humid temperate environment
in the northern hemisphere, or a tropical region, it
is possible that the maximum river flow will occur
in the transition between years (i.e. December/
January). It is possible for a storm to last over the
31 December/1 January period and the same storm
to be the maximum flow value for both years. If the
flow regime is dominated by snow melt then it
is important to avoid splitting the hydrological
year at times of high melt (e.g. spring and early
summer). To avoid this it is necessary to choose your
hydrological year as changing during the period of
lowest flow. This may take some initial investigation
of the data.
All flood frequency analysis is concerned with the
analysis of frequency histograms and probability
distributions. Consequently the first data analysis
step should be to draw a frequency histogram. It is
often useful to convert the frequency into a relative
frequency (divide the number of readings in each
class interval by the total number of readings in the
data series).
The worked example given is for a data set on
the river Wye in mid-Wales (see pp. 113-114). On
looking at the histogram of the Wye data set (Figure
6.11) the first obvious point to note is that it is not
normally distributed (i.e. it is not a classic bell-
shaped curve). It is important to grasp the signifi-
cance of the non-normal distribution for two
reasons:
pd3, am3
pd4, am5
pd2, am2
Q
pd1
am4
am1
1980
1981
1982
1983
1984
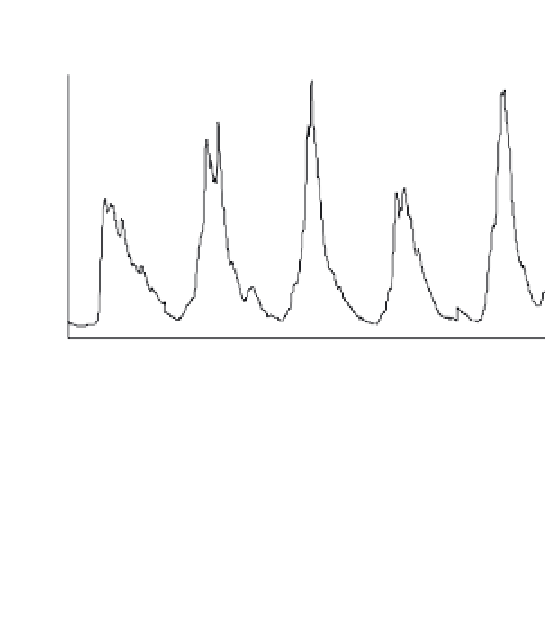
Figure 6.10
Daily flow record for the Adams river
(British Columbia, Canada) during five years in the
1980s. Annual maximum series are denoted by 'am',
partial duration series above the threshold line by 'pd'.
NB In this record there are five annual maximum data
points and only four partial duration points, including
two from within 1981.
Source
: Data courtesy of Environment Canada
use of either data series in flood frequency analysis.
Annual maximum may miss a large storm event
where it occurs more than once during a year (as in
the 1981 case in Figure 6.10), but it does provide
a continuous series of data that are relatively easy
to process. The setting of a threshold storm (the
horizontal line in Figure 6.10) is critical in analysis
of the partial duration series, something that
requires considerable experience to get right. The
most common analysis is on annual maximum
series, the simplest form, which is described here. If
the data series is longer than ten years then the
annual maxima can be used; for very short periods
of record the partial duration series can be used.
The first step in carrying out flood frequency
analysis is to obtain the data series (in this case
annual maxima). The annual maximum series
should be for as long as the data record allows. The
greater the length of record the more certainty can
be attached to the prediction of average recurrence
interval. Many hydrological database software
packages (e.g. HYDSYS) will give annual maxima
data automatically, but some forethought is required
on what annual period is to be used. There is an
1
Common statistical techniques that require
normally distributed data (e.g. t-tests etc.) can-
not be applied in flood frequency analysis.
2
It shows what you might expect: small events
are more common than large floods, but that
very large flood events do occur; i.e. a high
magnitude, low frequency relationship.
If you were to assume that the data series is infinitely
large in number and the class intervals were made
extremely small, then a smooth curve can be drawn