Geoscience Reference
In-Depth Information
FREQUENCY ANALYSIS
The analysis of how often an event is likely to occur
is an important concept in hydrology. It is the
application of statistical theory into an area that
affects many people's lives, whether it be through
flooding or low flows and drought. Both of these are
considered here, although because they use similar
techniques the main emphasis is on
flood fre-
quency analysis
. The technique is a statistical
examination of the frequency-magnitude relation-
ship discussed in Chapters 2 and 5. It is an attempt
to place a probability on the likelihood of a certain
event occurring. Predominantly it is concerned with
the low-frequency, high-magnitude events (e.g. a
large flood or a very low river flow).
It is important to differentiate between the uses
of flow duration curves and frequency analysis. Flow
duration curves tell us the percentage of time that
a flow is above or below a certain level. This is
average data and describes the overall flow regime.
Flood frequency analysis is concerned only with
peak flows: the probability of a certain flood recur-
ring. Conversely,
low flow frequency analysis
is
concerned purely with the lowest flows and the
probability of them recurring.
0
50
100
% time flow exceeded
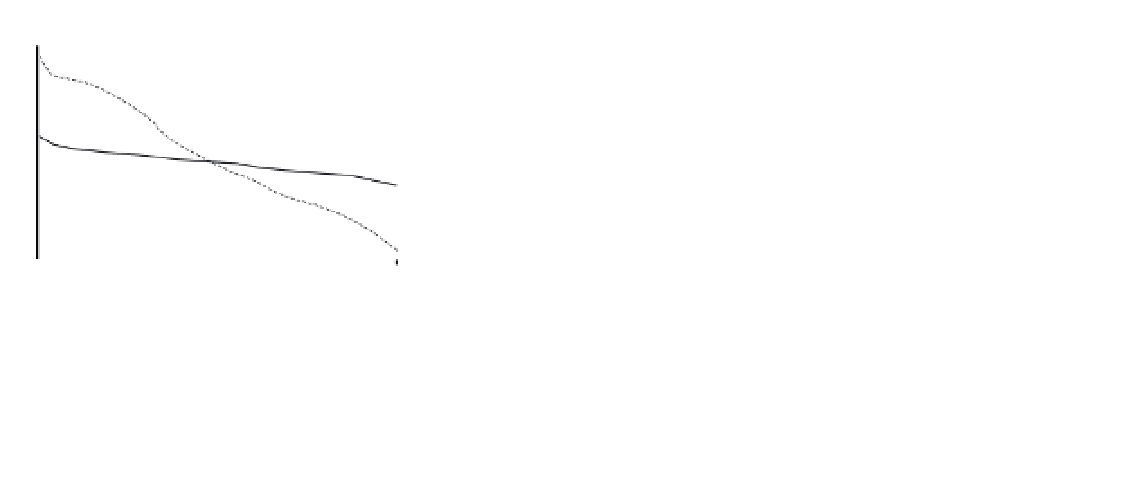
Figure 6.6
Two contrasting flow duration curves.
The dotted line has a high variability in flow (similar
to a small upland catchment) compared to the solid line
(similar to a catchment with a high baseflow).
large difference between the highest and lowest flow
values, whereas for the solid line there is far less
variation. This tells us that the catchment shown
by the solid line never has particularly low flows or
particularly high flows. This type of hydrological
response is found in limestone or chalk catchments
where there is a high baseflow in the summer
(groundwater derived) and high infiltration rates
during storm events. In contrast the catchment
shown with a solid line has far more variation.
During dry periods it has a very low flow, but
responds to rainfall events with a high flow. This is
characteristic of impermeable upland catchments or
streamflow in dryland areas.
Flood frequency analysis
Flood frequency analysis is probably the most
important hydrological technique. The concept of a
'100-year flood', or a fifty-year recurrence interval,
is well established in most people's perceptions of
hydrology, although there are many misunderstand-
ings in interpretation.
Flood frequency analysis is concerned with peak
flows. There are two different ways that a peak flow
can be defined:
Statistics derived from a flow duration curve
The interpretation of flow duration curve shape
discussed so far is essentially subjective. In order to
introduce some objectivity there are statistics
derived from the curve; the three most important
ones are:
•
The flow value that is exceeded 95 per cent of the
time (
Q
95
). A useful statistic for low flow analysis.
•
the single maximum peak within a year of record
giving an
annual maximum series
; or
•
The flow value that is exceeded 50 per cent of the
time (
Q
50
). This is the median flow value.
•
any flow above a certain threshold value, giving
a
partial duration series
.
•
The flow value that is exceeded 10 per cent of the
time (
Q
10
). A useful statistic for analysis of high
flows and flooding.
Figure 6.10 shows the difference between these two
data series. There are arguments for and against the