Geoscience Reference
In-Depth Information
Worked example of the unit hydrograph
The Tanllwyth is a small (0.98 km
2
) headwater
tributary of the Severn river in mid-Wales.
The catchment is monitored by the Centre for
Ecology and Hydrology (formerly the Institute of
Hydrology) as part of the Plynlimon catchment
experiment. For this example a storm was chosen
from July 1982 as it is a simple single-peaked
hydrograph (see Figure 6.2).
2
1.8
1.6
1.4
1.2
1
0.8
0.6
0.4
0.2
0
12 34 56 78 9 0
Figure 6.4
The unit hydrograph for the Tanllwyth
catchment.
15
0.1
NB the hydrograph appears more spread out
because of the scale of drawing.
To apply the unit hydrograph to a small storm,
hydrographs were added together for each amount
of effective rainfall. The resultant total hydrograph
is shown as a dark black line in Figure 6.5. The
discharge values in the simulated hydrograph are
much larger than those in the original storm
hydrograph despite what appears to be a smaller
storm. This is because the simulated hydrograph
is working on effective rainfall rather than actual
rainfall. Effective rainfall is the rain that doesn't
infiltrate and is theoretically available for storm
runoff. A low effective rainfall value may represent
a high actual rainfall value.
10
0.05
5
0
0
1
6
11
16
21
26
31
36
41
Time (hours)
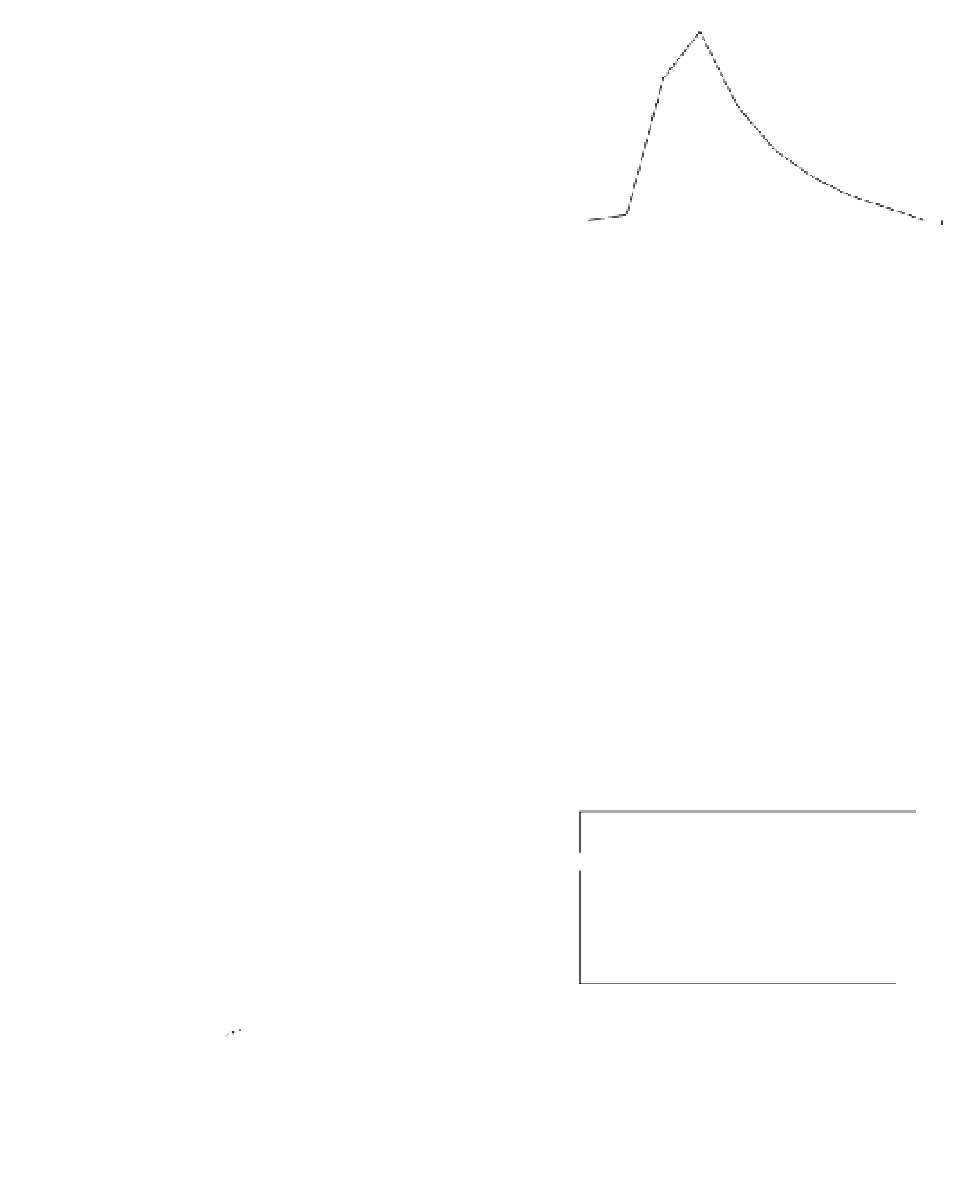
Figure 6.2
A simple storm hydrograph (July 1982)
from the Tanllwyth catchment.
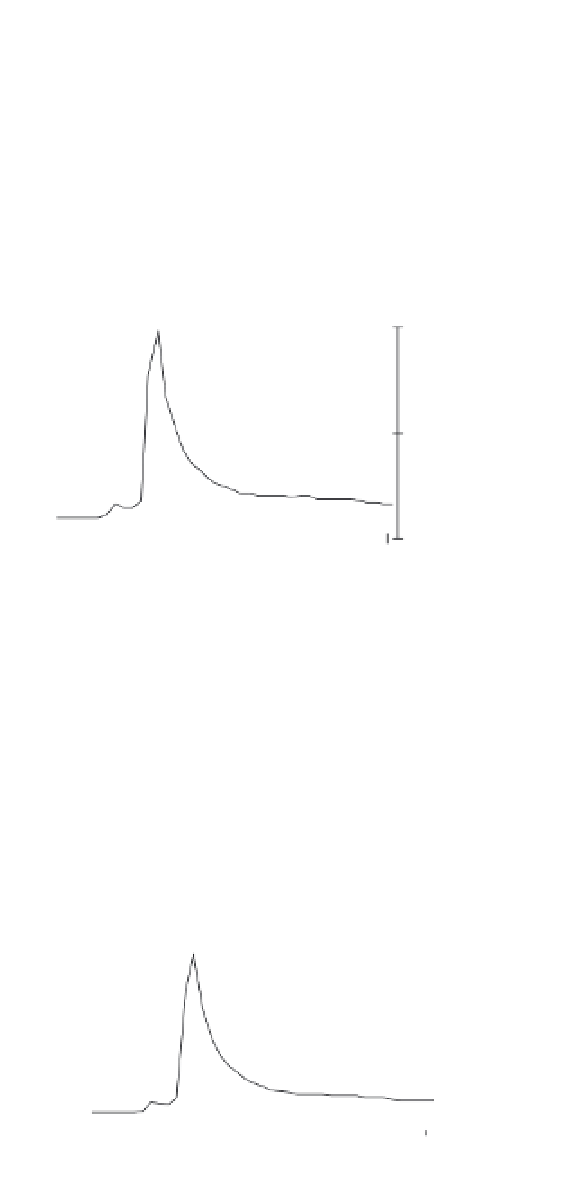
Baseflow separation was carried out by using a
straight-line method. The right-hand end of the
straight line (shown as a broken line in Figure 6.3)
is where the receding limb of the hydrograph
became exponential.
All of the flow above the broken line in Figure
6.3 was then divided by the effective rainfall to
derive the unit hydrograph in Figure 6.4 below.
0
1
3
0.1
m
3
/s
2
1
0
0.05
1
2
3
4
5
6
7
8
9
10
11
Figure 6.5
Applying the unit hydrograph to a small
storm (effective rainfall shown on the separate scale
above). The different lines represent the flow from
each of the rainfall bars (thin solid first, then dotted,
then dashed). The solid black line is the total
discharge i.e. the sum of the three lines.
0
0
10
20
30
40
Time (hours)
Figure 6.3
Baseflow separation.