Geoscience Reference
In-Depth Information
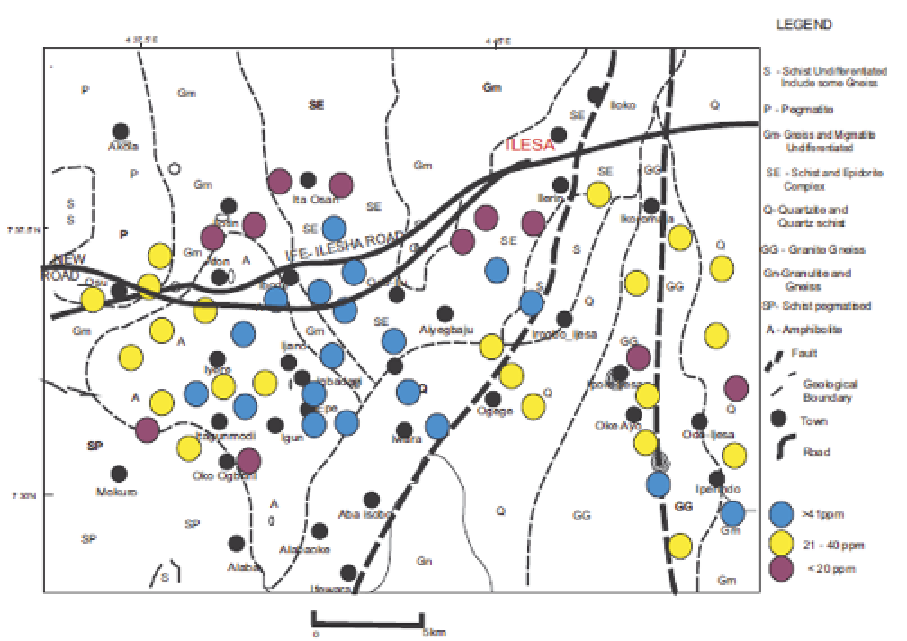
Fig. 3. Map showing the association ratio of Fe - Mn in the study area.
The association ratio of Pb - Cr are as shown in Figure 4. The higher values with
concentration greater than 21ppm are more widely distributed than the Fe - Mn association
ratio. However, most of the higher values are still concentrated on the Amphibolite,
Quartzite/Quartz Schist and Schist Epidiorite Complex, though, with some moderate and
lower values in between them. The association ratio of Cd - Zn is shown in Figure 5. The
values are seen to be more widely distributed for most part of the figure. This shows the
spread of the association over the basement rocks. Cd is known universally to associate with
Zn. It actually reflects the strong lithologic influence related to the mafic minerals with
which Zn is associated. It can thus be seen, that for the plotted concentration ratios, higher
values of the metallic association are distributed largely towards the centre of the study
area. This partly corresponds to the suggested mineralized areas by previous geological and
geophysical studies of Ako (1980) and Ajayi (1988). Similar studies (such as the present one)
were carried out on the Elura Deposit in the Cobar Mining district of Central New South
Wales, Australia. The study identified high grade Zn - Pb - Agsulphide mineralization and
this was later followed by extensive geophysical surveys to map the siliceous, pyriticand the
pyrrhotitic ores (Palacky, 1988). A combined map of Figures 3, 4 and 5 is as shown in Figure
6. This gives the combined map for the geochemical anomaly over the study area. The Fe -
Mn ratio is represented in red circles, the Pb - Cr ratio is represented in green circles while
the Cd - Zn ratio is represented in blue circles. The anomaly is seen to be widely distributed
over the delineated area. Also shown on the map are the geophysical locations and traverses
to investigate the anomaly.
Search WWH ::

Custom Search