Geoscience Reference
In-Depth Information
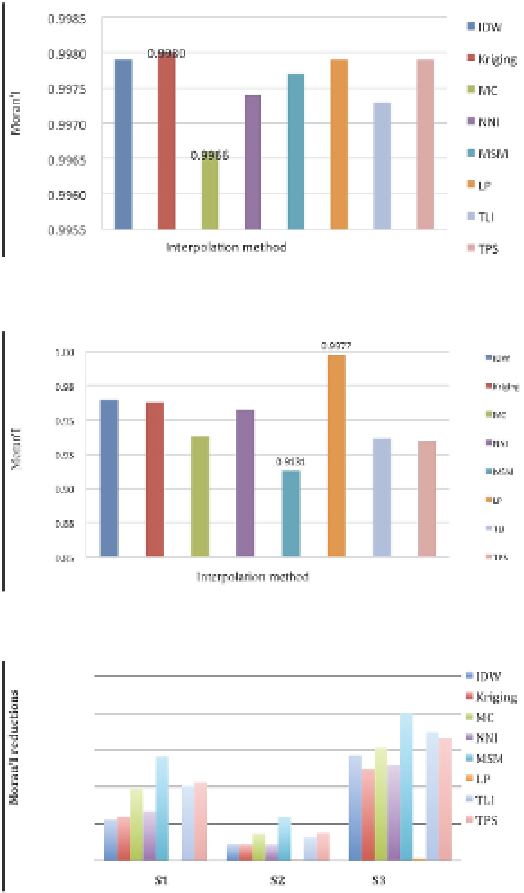
Fig. 4. Moran'I statistics of S1 (RMSE = 0)
Fig. 5. Moran'I statistics of S1 (RMSE = 10)
Fig. 6. Comparisons of Moran'I reductions among three surfaces
correlation, Fig. 6 reveals the overall variations of the three surfaces. Though Moran'I
reductions of the three surfaces have a few differences, they share the same changing
tendency. No matter what surface it is, the Moran'I reductions caused by interpolation LP is
the smallest with its spatial correlation kept best, while MSM loses most. And the increasing
sequence between LP and MSM is listed as follows: IDW, Kriging, NNI < MC, TLI, TPS, which
is nearly in accordance with the statistical results of RMSE and ME given in Section 4.1.
4.3 Volume and surface area
To further analyze the maintenance of overall performance after interpolation, the absolute
differences between the 'true' volume and volumes calculated by surfaces interpolated by
different models have been compared, except NNI and TLI for their boundary effect. Still
taking the first surface for example, the absolute volume difference showed in Fig. 7 stands


Search WWH ::

Custom Search