Geoscience Reference
In-Depth Information
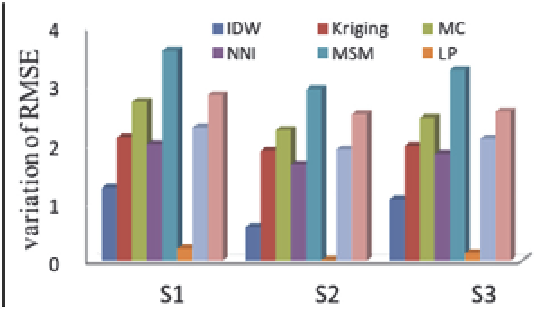
Fig. 3. Changes in RMSEs of the three surfaces before and after adding errors
Actually, it is not difficult to explain the results. When sample points have no errors or small
errors, these sample points themselves can portray the characteristics of the original surface
in a relatively accurate degree. Using semi-variogram, the geostatistical method of Kriging
recovers the spatial correlation of the original surface exactly, while TPS and MSM are
means of finding a proper way to allocate weights to sample points according to the
distance between known points and interpolated points. With the increasing of sample data
errors, the surface generated by sample points starts to deviate from the original surface,
meaning the sample surface can no longer describe the characteristics of the original surface
completely. No matter Kriging or TPS, the surfaces they want to depict or recover are just
sample surfaces. For LP, although not all of the sample points are strictly passed through,
this interpolated method can make a certain restraint on the original data errors, showing a
role of peak-clipping and valley-filling for the interpolation. Furthermore, the restraining
effect can also reflect the variation tendency of the surfaces created by sample points,
bringing about a higher interpolated precision. The interpolated results for the three
surfaces with different complexity levels have been showed by Fig. 3. On the whole, the
changing tendencies of these three surfaces present a roughly consistent pace, that is to say
the largest change of RMSE before and after adding errors belongs to MSM with the
minimum belonging to LP, and an ascending order between the two extremes are as
follows: TPS, MC, TLI, NNI and IDW. It has been further proved that the interpolated
method of LP is less vulnerable to data errors appearing a superior resistance to errors,
while MSM is extremely sensitive to data errors showing a worst error-resistance.
4.2 Moran'I index
The Moran'I statistics of S1 with no data-errors and higher data-errors acquired from
different interpolation methods have been compared in Fig. 4 and Fig. 5. For the data
without errors, the Moran'I of Kriging 0.9980 reaches the topmost showing the best spatial
correlation, then followed by LP, TPS and IDW with a better spatial correlation, and the
lowest Moran'I belongs to MC whose spatial correlation is the worst (refer to Fig. 4).
However, with the increasing of the sample data errors, the Moran'I of LP, 0.9977, changes
to the highest with the optimal spatial correlation and by contrast, MSM turns to the lowest
as shown by Fig. 5. The other two surfaces present a similar variation regularity or tendency
for the entire, although there are a few differences among individual interpolation methods.
In order to further interpret the impact caused by the increasing data-errors on spatial


Search WWH ::

Custom Search