Geoscience Reference
In-Depth Information
e
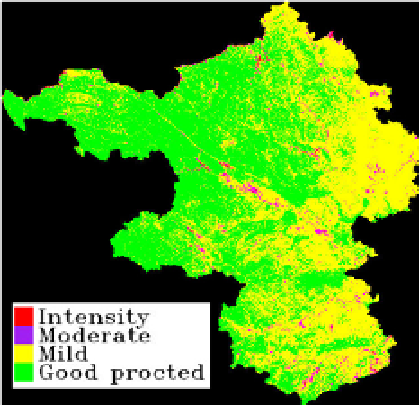
Fig. 4. The RD extent mapping in 2000 (a) 2003 (b), 2006 (c), 2008 (d) and 2010(e)
Compared the results from 2000, 2003, 2006, 2008, and 2010, it is clearly found that the good
protected area has decreased from 2000 to 2006, and increased again from 2006 to 2010 in
west part of the study area; the mild and moderate RD area is increasing dramatically in
middle and north part of the study area. Nevertheless, intense RD area is seldom noted in
all years, which may indicate that the environment of the study area does not deteriorate
very badly. A change table of class statistics was made as shown in Table 2, which gives the
percentages of each class in the whole area. It is clear that good protected area decreased
from 2000 to 2006 and increased again from 2006 to 2010, while intense and moderate areas
are relatively stable, and mild area decreased remarkably from 2006 to 2010. This indicates
that many mild areas have been converted to good protected lands since 2006 due to
governmental land protection policies.
intensity
moderate
mild
good protected
percent
0.12%
1.15%
37.98%
60.76%
2000
area(km
2
)
85.71
847.40
28104.77
44962.13
percent
0.21%
6.15%
66.79%
26.86%
2003
area(km
2
)
151.98
4548.10
49422.80
19877.12
percent
0.20%
3.91%
72.45%
23.44%
2006
area(km
2
)
145.59
2892.45
53613.76
17348.20
percent
0.35%
3.73%
57.49%
38.44%
2008
area(km
2
)
257.39
2756.87
42542.88
28442.86
percent
0.33%
1.68%
46.47%
51.52%
2010
area(km
2
)
247.24
1242.65
34387.04
38123.07
Table 2. The RD extent in 2000, 2003, 2006, 2008, and 2010


Search WWH ::

Custom Search